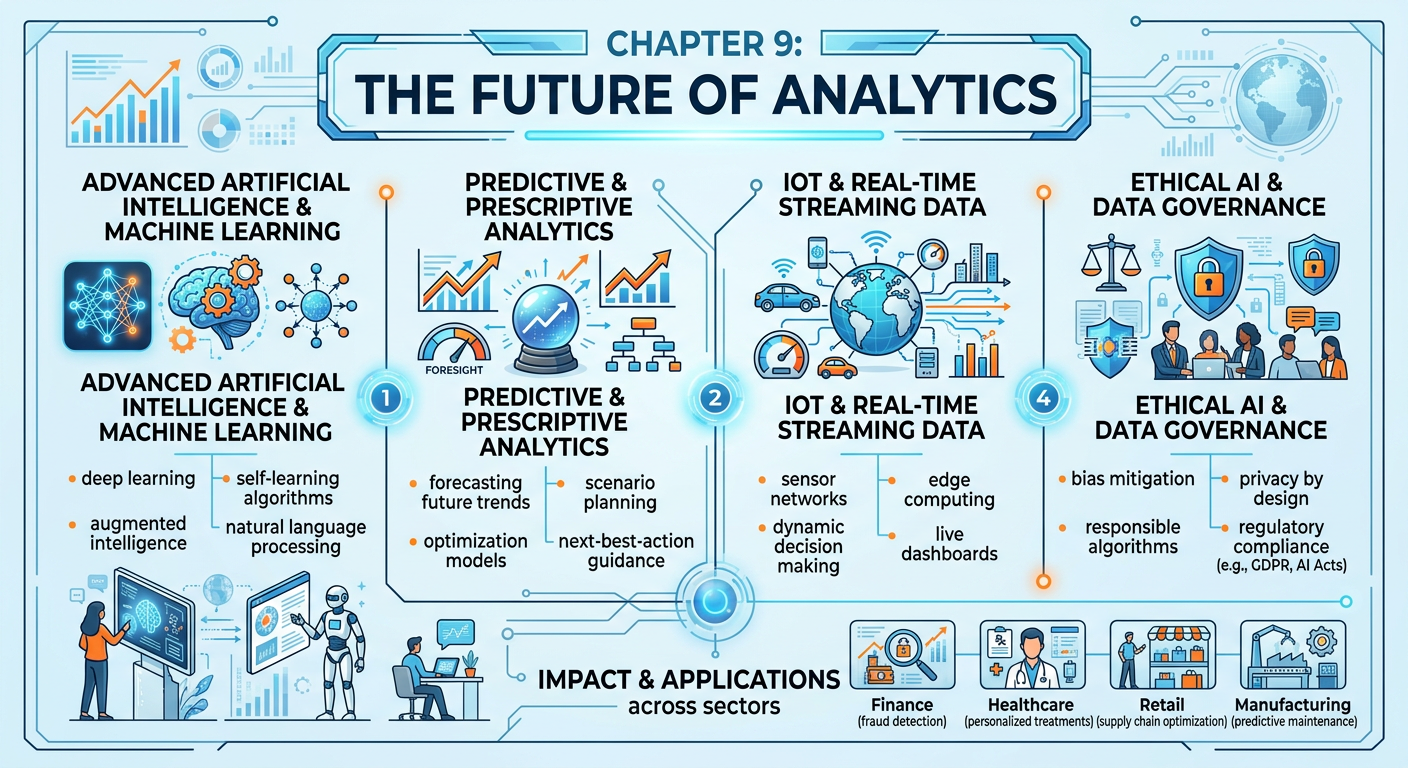
Figure 1:Explainer Infographic: Chapter 9: The Future of Analytics.
19.1 Introduction: Standing at the Threshold
Every technology revolution has a moment when practitioners look up from their current tools and ask: what comes next? For business analytics professionals, that moment is right now. The field has matured with extraordinary speed — from spreadsheet-driven reporting in the 1990s, through the big data era of the 2000s, into the machine learning renaissance of the 2010s, and now into an age where generative artificial intelligence is rewriting the rules of every discipline it touches, including analytics itself.
As graduate students in the FAU ISM 6405 program, you are uniquely positioned at this inflection point. You have built a rigorous foundation across eight chapters: data wrangling, statistical inference, predictive modeling, visualization, machine learning, NLP, prescriptive analytics, and ethical AI. Now, in this final chapter, we zoom out. We explore the macro-forces shaping the next decade of analytics, and we prepare you to demonstrate your mastery through the capstone Final Project — a seven-minute presentation pitch that synthesizes everything you have learned into a real-world analytics proposal you genuinely care about.
This chapter is not a prediction of the future. No author can promise which specific technologies will dominate in five years. Instead, it is a structured tour of the most credible, well-evidenced trends currently reshaping how organizations collect, interpret, and act on data — and how you, as an analytics professional, can remain relevant, adaptive, and impactful regardless of which specific tools rise or fall.
29.2 The AI-Native Analytics Organization
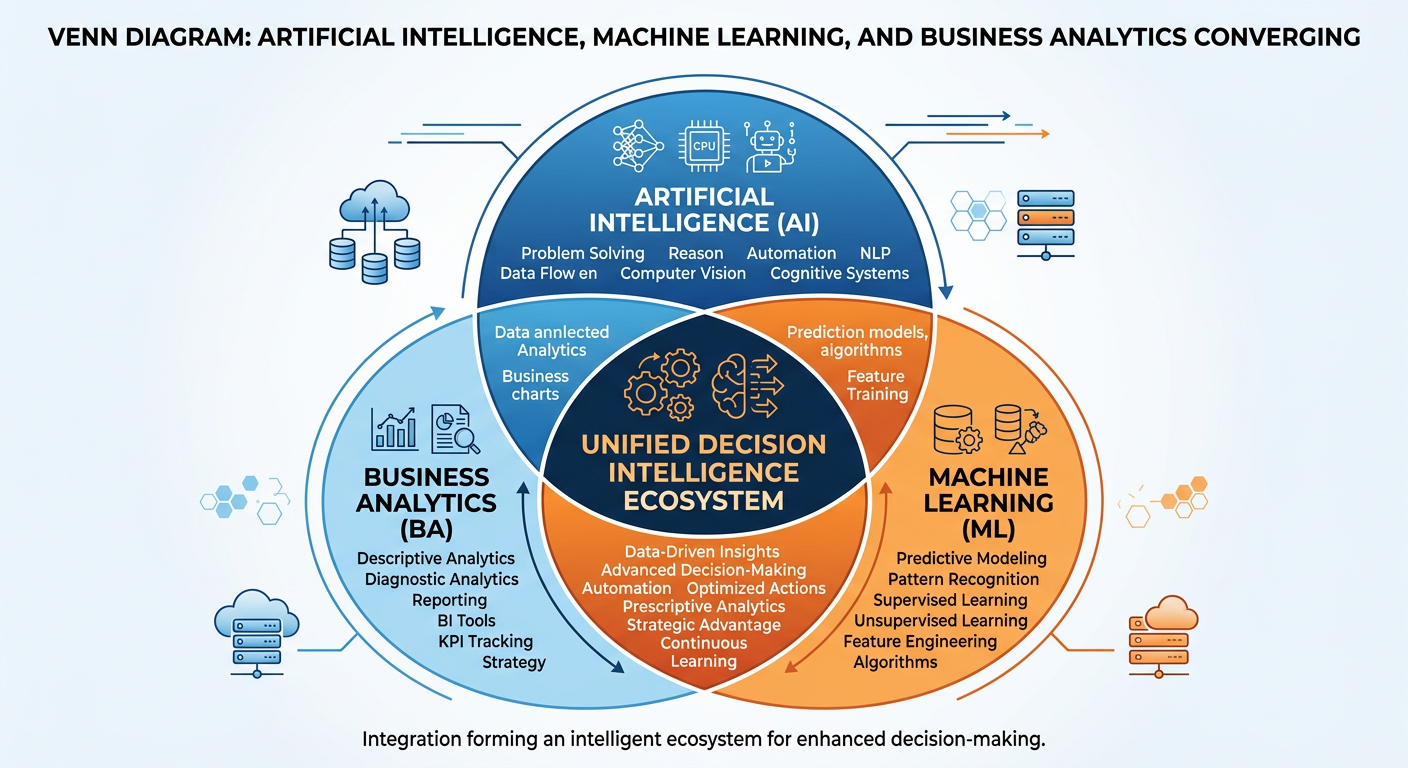
Figure 2:The AI-Native Analytics Organization: a new operating model where AI agents and human analysts collaborate continuously.
The concept of an “AI-native” organization is still emerging, but its implications for analytics are profound. Traditional analytics teams operated in a sequential model: data engineers prepared data, analysts explored it, data scientists modeled it, and business users consumed reports. This pipeline was effective but slow — often taking weeks to answer a single complex business question.
AI-native organizations collapse this pipeline. Large language models (LLMs) and autonomous AI agents can now draft SQL queries, generate Python scripts, interpret statistical outputs, and produce natural-language summaries — all in seconds. Tools like Microsoft Copilot embedded in Power BI, Google Gemini for Looker, and OpenAI’s Code Interpreter within ChatGPT have moved from experimental to production-grade. By 2025–2026, agentic analytics capabilities — where AI agents autonomously generate queries, run analyses, and narrate findings without human-in-the-loop prompting — have entered early enterprise deployment at scale. Organizations that embed these capabilities into their analytics workflows are not just working faster; they are fundamentally changing who can do analytics.
This democratization of analytics is one of the most significant shifts in the field’s history. A marketing manager with no formal data science training can now prompt an AI system to build a customer segmentation model, visualize the results, and draft an executive summary — in an afternoon. This is not a threat to analytics professionals; it is a mandate. The professionals who thrive will be those who understand enough about model mechanics, data quality, and business context to supervise, validate, and improve what AI systems produce. The role shifts from builder to orchestrator.
39.3 Augmented Analytics and Natural Language Interfaces
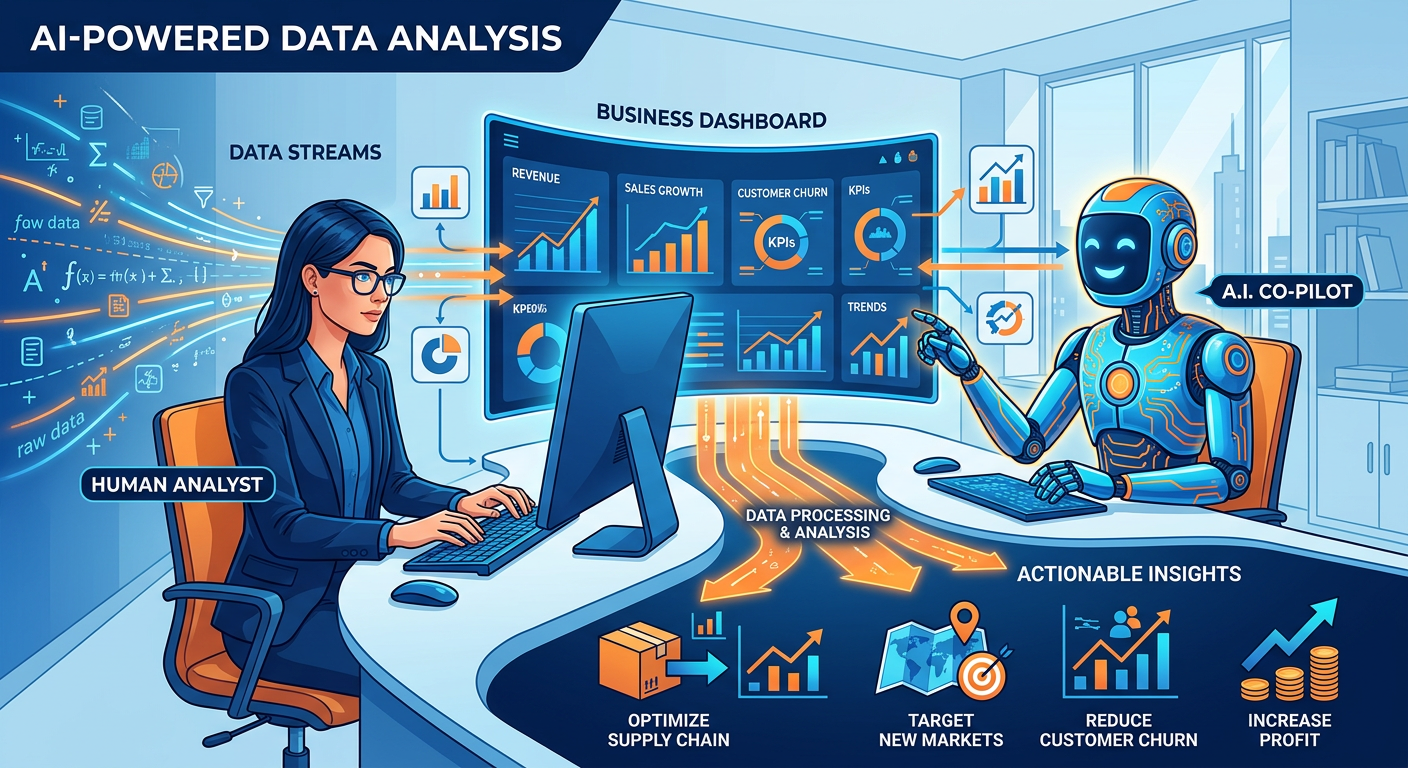
Figure 3:Augmented Analytics: how natural language interfaces transform the analytics experience for business users.
Gartner coined the term augmented analytics around 2017, describing the use of machine learning and natural language processing to automate data preparation, insight generation, and explanation. What was a research forecast then is a commercial reality now. Platforms like Tableau Pulse, Microsoft Copilot for Power BI, Qlik AutoML, and ThoughtSpot Sage allow users to ask questions in plain English and receive not just charts, but narratives: “Revenue declined 14% in Q3 compared to Q2, primarily driven by a drop in the Southeast region, where the largest accounts reduced order frequency by 22%.”
This represents a fundamental shift in the analytics value chain. The bottleneck is no longer accessing insight — it is acting on it. Organizations are investing heavily in what practitioners call the “last mile” of analytics: the translation of insight into decision and action. This is where business acumen, communication skills, and organizational change management become as important as technical expertise. As you look toward your post-graduation careers, recognize that the analysts who rise into leadership are rarely those who built the most sophisticated model — they are those who most effectively connected insight to outcome.
Natural language generation (NLG) has been largely superseded by — or deeply integrated with — generative AI. By 2025, LLM-powered platforms including Salesforce Einstein (which absorbed Narrative Science), Arria NLG, and purpose-built analytics agents can produce thousands of dynamically customized analytical narratives per hour, each tailored to a specific audience. The CFO gets a financial narrative; the regional manager gets a location-specific operations summary; the product team gets a feature-usage digest — all from the same underlying data model, all generated without human writing time.
49.4 Real-Time and Streaming Analytics
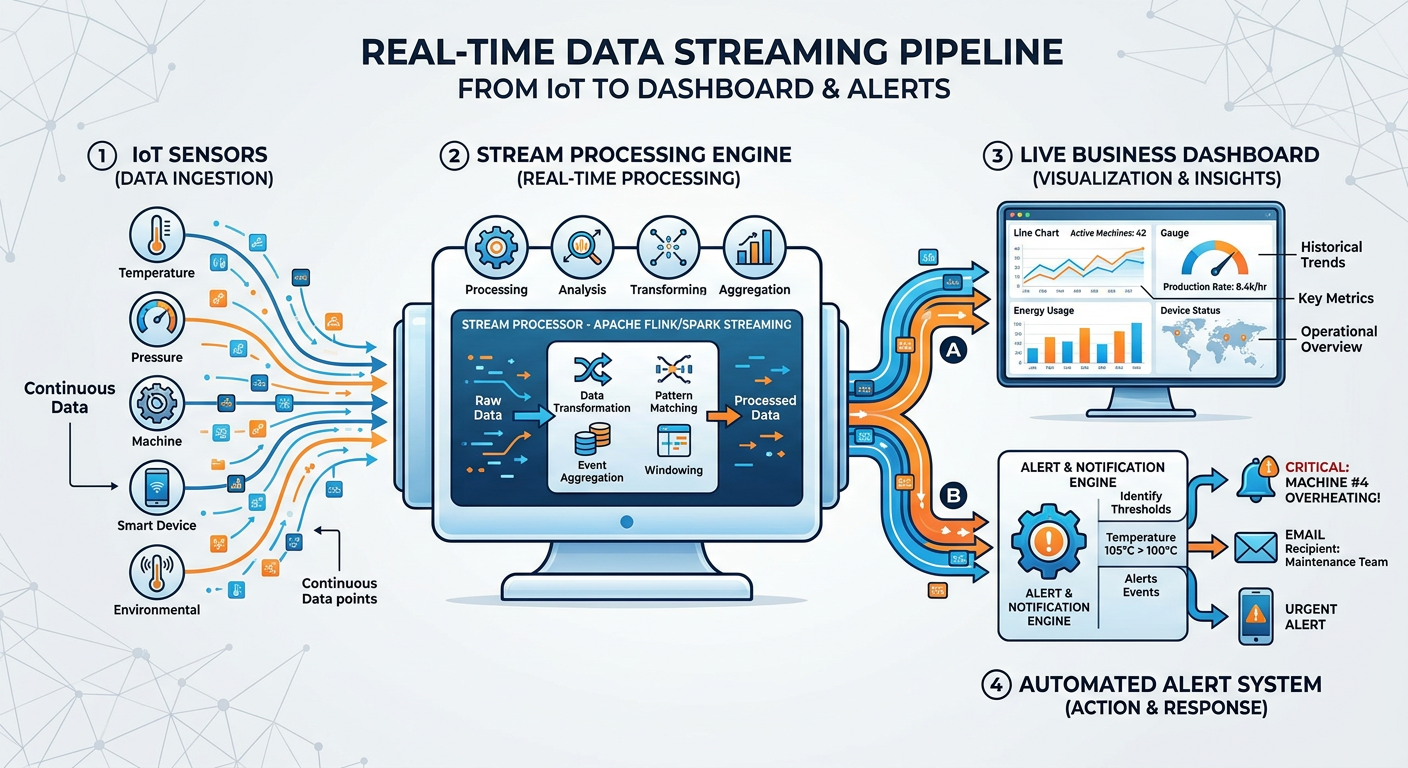
Figure 4:Streaming Analytics Architecture: from event source to real-time decision in milliseconds.
Batch processing — the practice of collecting data over a period and analyzing it as a group — is giving way to streaming analytics in a growing number of industries. When a customer abandons a shopping cart, a bank flags a potentially fraudulent transaction, or an autonomous vehicle encounters an unexpected obstacle, waiting hours or even minutes for a batch job is not acceptable. Decisions must happen in milliseconds.
Technologies like Apache Kafka, Apache Flink, and Amazon Kinesis have made streaming data pipelines accessible to organizations of all sizes. The analytics implications are significant. Models that were previously trained on historical data and deployed statically must now support online learning — continuously updating their parameters as new data arrives. This creates challenges in model governance, drift detection, and explainability that the analytics community is still actively solving.
In healthcare, streaming analytics enables real-time patient monitoring that alerts clinicians to deteriorating conditions before they become emergencies. In retail, it powers dynamic pricing engines that adjust product prices hundreds of times per day based on competitor signals, inventory levels, and demand patterns. In financial services, it underpins the fraud detection systems that silently protect millions of transactions every second.
59.5 Edge Analytics and the Internet of Things
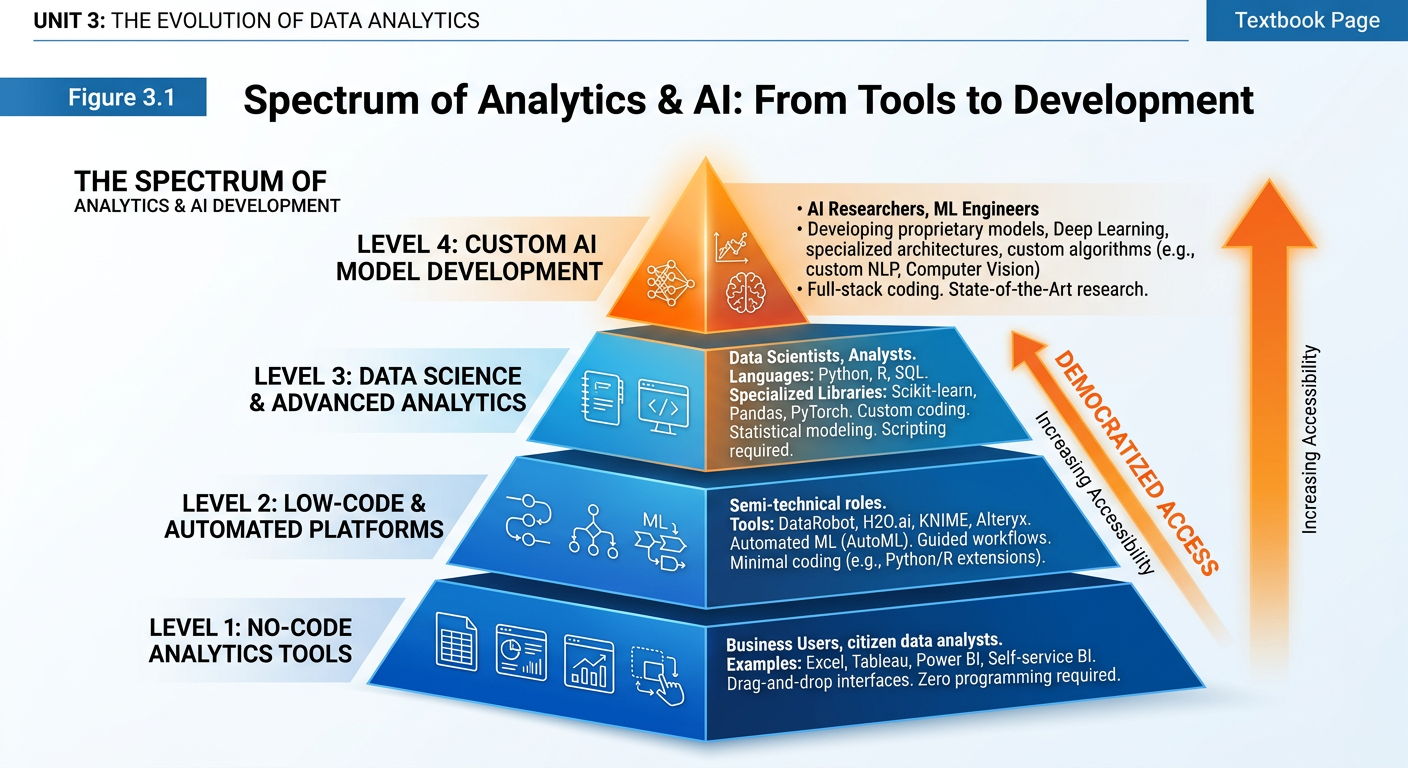
Figure 5:Edge Analytics Hierarchy: processing intelligence closer to the data source reduces latency and bandwidth costs.
The Internet of Things (IoT) has created an almost incomprehensible volume of data — IDC reports that connected devices generated over 80 zettabytes of data in 2025, surpassing earlier projections, with forecasts of over 180 zettabytes by 2030. Routing all of this to centralized cloud data warehouses for analysis is neither economically nor technically feasible. Enter edge analytics: processing data on or near the device that generates it, before it ever reaches the cloud.
Edge analytics is transforming manufacturing through predictive maintenance programs that analyze vibration, temperature, and acoustic signals from machinery on-site, triggering maintenance alerts without transmitting raw sensor data to the cloud. It is enabling smart city infrastructure where traffic management systems make real-time signal adjustments based on locally processed camera feeds. It is powering precision agriculture, where autonomous tractors make per-square-meter planting decisions based on soil sensor readings analyzed onboard.
For analytics professionals, edge environments introduce new constraints: limited compute power, restricted memory, intermittent connectivity, and the absence of centralized governance. Models deployed to edge devices must be extraordinarily efficient — techniques like model quantization, pruning, and knowledge distillation are becoming core competencies for practitioners working in these environments.
69.6 Responsible AI and Ethical Analytics at Scale
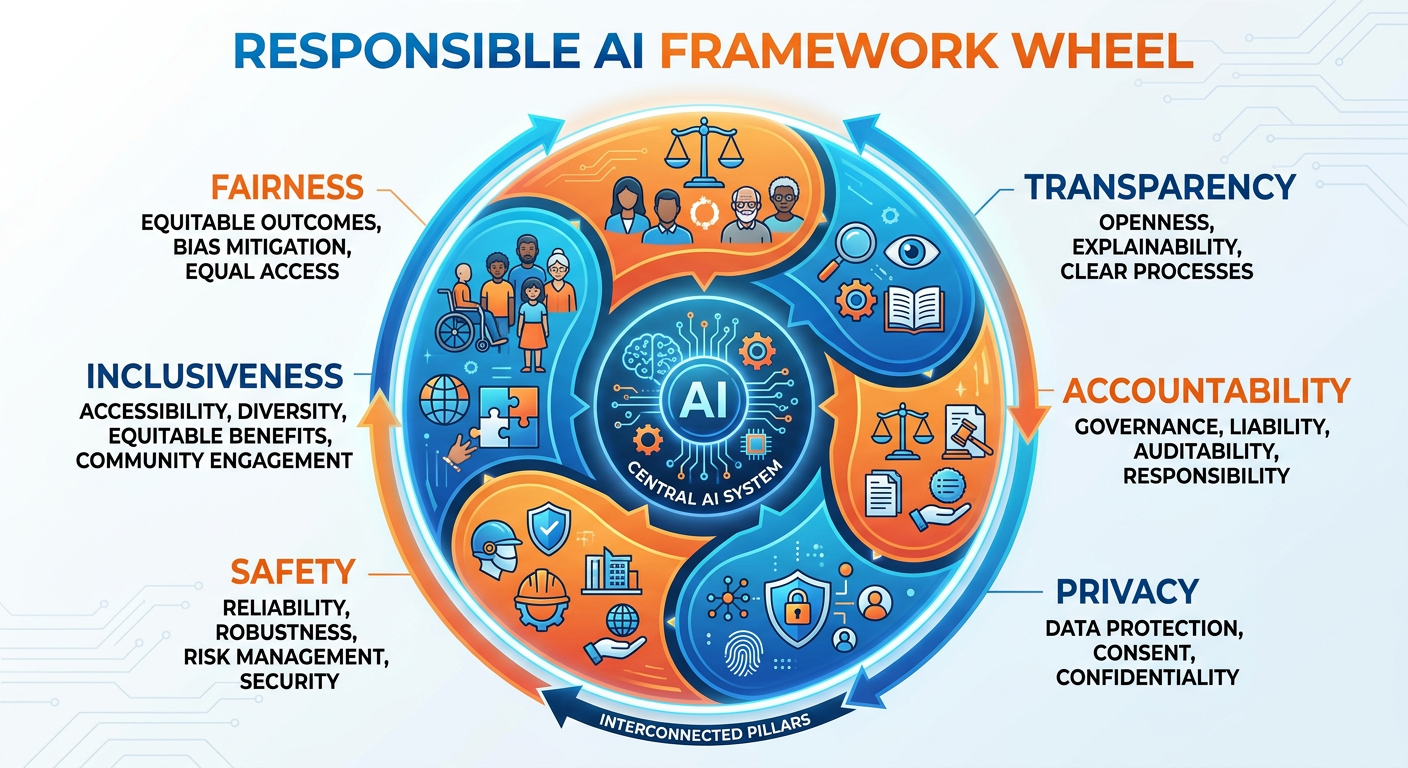
Figure 6:The Four Pillars of Responsible AI: fairness, accountability, transparency, and privacy form the foundation of trustworthy analytics systems.
Chapter 8 introduced the ethical dimensions of AI and analytics in depth. As we look to the future, it is important to recognize that responsible AI is not a compliance checkbox — it is becoming a competitive differentiator and a regulatory necessity. The European Union’s AI Act — the world’s first comprehensive AI regulation — is now actively enforced. Prohibitions on unacceptable-risk AI took effect in February 2025, foundational governance obligations applied from August 2025, and the full compliance framework for high-risk AI systems (including recruitment tools, credit scoring systems, and medical diagnostics) applies from August 2026. Similar regulatory frameworks have advanced or passed in the United States (state-level AI bills in California, Texas, and Colorado), Canada, Brazil, and the UK.
Organizations that proactively invest in AI governance infrastructure — model registries, bias auditing pipelines, explainability dashboards, and data lineage tracking — will be better positioned when regulations crystallize. More importantly, they will build the stakeholder trust necessary for analytical systems to actually influence decisions. A sophisticated model that decision-makers do not trust will be ignored, regardless of its accuracy metrics.
The analytics profession is also grappling with the environmental cost of AI. Training large foundation models requires extraordinary amounts of energy. Researchers at the University of Massachusetts estimated that training a single large transformer model can emit as much carbon as five automobiles over their entire lifetimes. As sustainability becomes a board-level priority, analytics teams will face pressure to justify the environmental footprint of their work and to favor efficient architectures over brute-force computational scale.
79.7 The Analytics Talent Landscape: What Skills Will Define the Next Decade
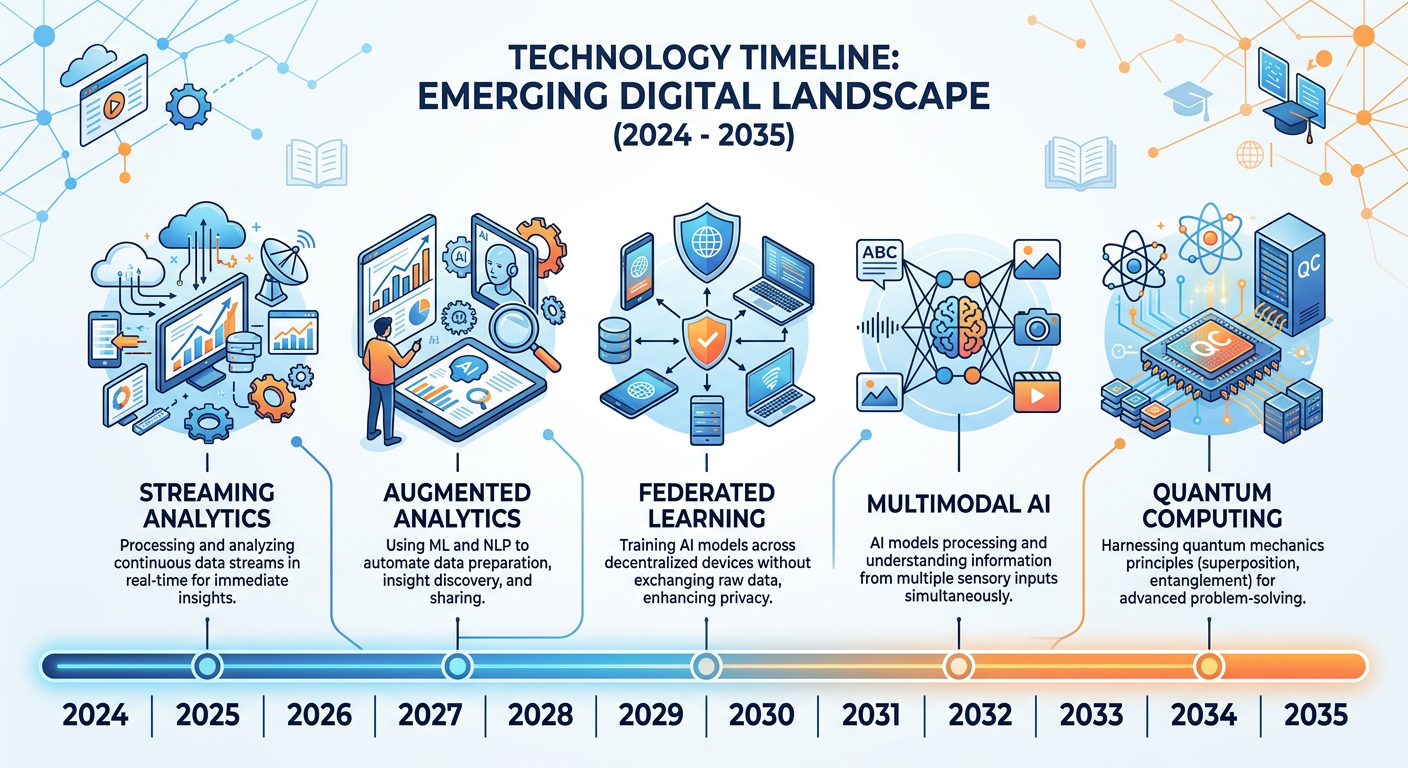
Figure 7:Future Analytics Talent Profile: the skills that will define successful analytics professionals over the next decade.
The World Economic Forum’s Future of Jobs reports consistently identify data analysis, AI literacy, and critical thinking as among the most valuable skills of the coming decade. But the composition of the ideal analytics professional is shifting in interesting ways. Technical depth remains essential, but the premium on purely computational skills is declining as AI tools automate more of the mechanical work. The skills that are becoming more valuable — not less — are those that AI currently cannot replicate at human level.
Domain expertise is one such skill. An analyst who deeply understands healthcare operations, supply chain dynamics, or consumer financial behavior can ask better questions, spot anomalous results that a model missed, and translate findings into language that resonates with practitioners in that field. Domain expertise is the context layer that turns data into wisdom.
Communication and storytelling are another. The ability to construct a coherent analytical narrative — to take a complex multivariate result and explain it to a senior executive in three minutes, without sacrificing intellectual integrity — is rare and valuable. Organizations are investing in training programs specifically to build this capability because the alternative — brilliant analysis that never influences a decision — represents pure waste.
Finally, analytical leadership — the ability to design analytics programs, prioritize use cases by expected value, manage interdisciplinary teams, and align analytics investments with strategic organizational goals — is in acute shortage. This is the domain where ISM 6405 graduates are positioned to lead.
89.8 Emerging Frontiers: Quantum Computing, Synthetic Data, and Causal AI
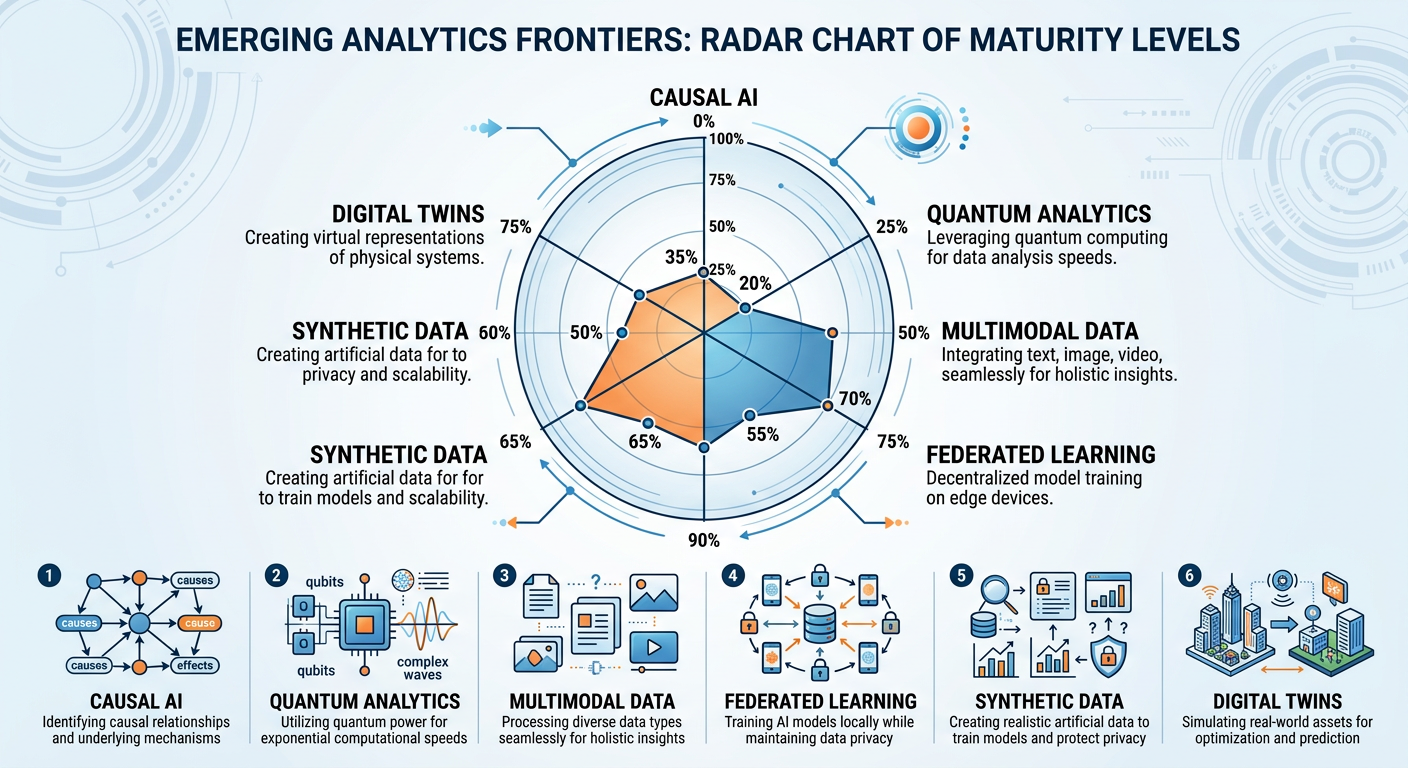
Figure 8:Emerging Frontiers in Business Analytics: quantum computing, synthetic data generation, and causal AI represent the next horizon of analytical capability.
Beyond the near-term trends discussed above, three more speculative but consequential frontiers deserve attention.
Quantum Computing holds the potential to solve certain optimization and simulation problems that are computationally intractable for classical computers. Logistics companies, pharmaceutical firms, and financial institutions are actively experimenting with quantum algorithms for portfolio optimization, drug discovery simulations, and cryptographic security. While broad commercial quantum advantage for real-world analytics use cases remains several years away for most organizations, early milestones are accelerating: Google’s Willow chip (2024) demonstrated exponential error reduction, and IBM’s 1,000+ qubit systems are enabling early financial optimization experiments. Analytics professionals in finance, logistics, and life sciences should begin developing quantum literacy now.
Synthetic Data is already transforming how organizations train machine learning models. When real data is scarce, sensitive, or legally restricted — as is often the case in healthcare, finance, and fraud detection — synthetically generated data that preserves the statistical properties of the original dataset without containing any real individual’s information can substitute. Generative adversarial networks (GANs), diffusion models, and LLM-based generation pipelines have made synthetic data generation increasingly realistic and accessible. By 2025, enterprise-grade synthetic data platforms like Gretel.ai, Mostly AI, and Tonic.ai are widely deployed in healthcare, finance, and government analytics programs. This technology is poised to break one of the most persistent bottlenecks in applied machine learning: the availability of labeled training data.
Causal AI addresses perhaps the most fundamental limitation of current machine learning — the inability to distinguish correlation from causation. Modern deep learning systems are extraordinarily good at pattern recognition but cannot reliably answer questions like “what caused this outcome?” or “what would happen if we intervened in this way?” Causal inference frameworks, championed by researchers like Judea Pearl and his Ladder of Causation, provide the theoretical foundations for AI systems that can reason about interventions and counterfactuals. Platforms integrating causal reasoning — like CausalNex and DoWhy — are gaining traction in industries where decision-making under uncertainty is the core challenge.
99.9 Building an Analytics Career in the AI Era
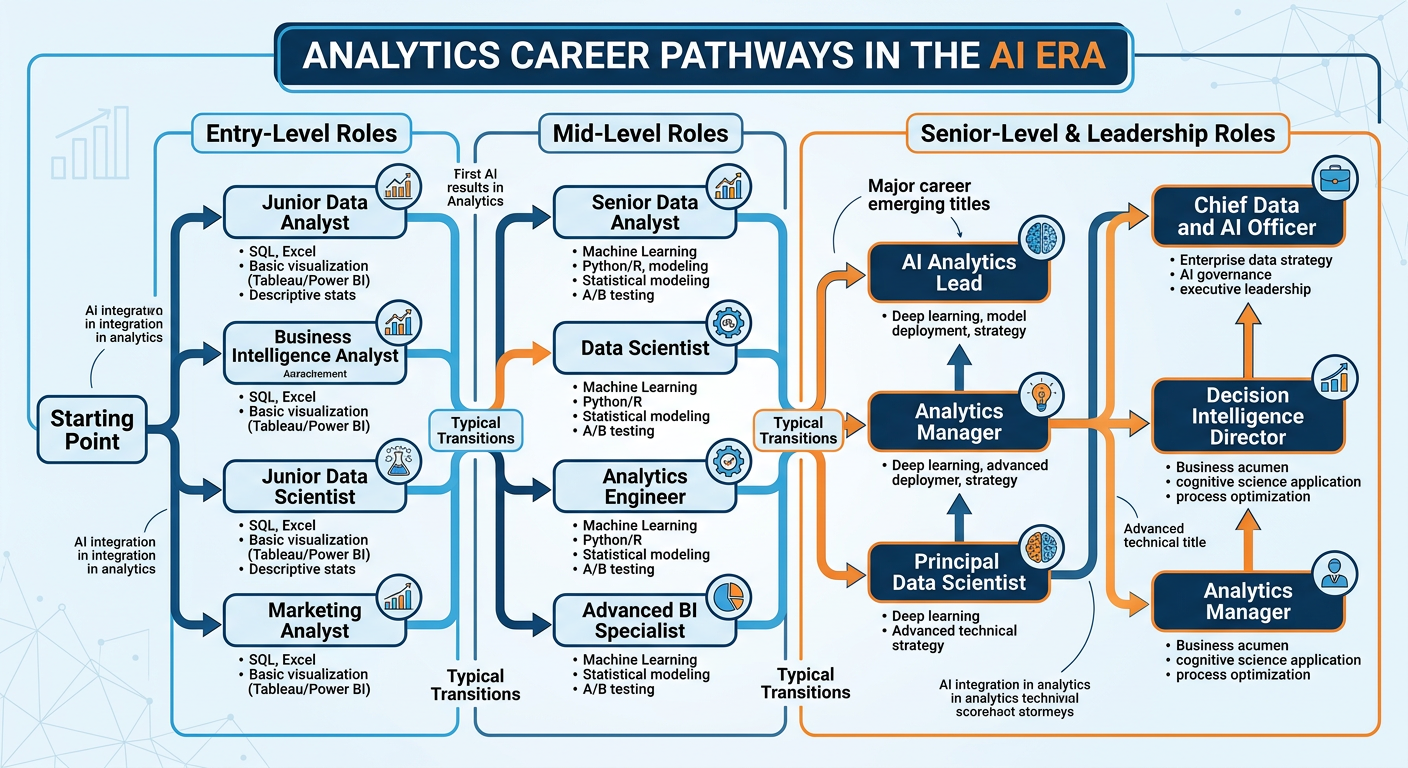
Figure 9:Analytics Career Pathways in the AI Era: navigating roles, transitions, and emerging opportunities.
Career strategy in a rapidly evolving field requires a different mindset than career strategy in a stable one. In stable fields, professionals climb a well-defined ladder: junior, senior, manager, director, VP. In analytics, the ladder itself is being rebuilt in real time. Job titles that did not exist five years ago — ML Engineer, Analytics Engineer, Decision Intelligence Manager, Prompt Engineer, AI Product Manager — are now common postings at Fortune 500 companies. Job titles that were prestigious a decade ago are being absorbed, automated, or redefined.
Several strategic principles apply regardless of which specific roles emerge. First, maintain a learning velocity that exceeds the rate of change in your field. Commit to continuous education — not just through formal degree programs, but through certifications, open-source contributions, Kaggle competitions, conference participation, and deliberate reading of primary research literature. Second, build a professional portfolio that demonstrates your analytical capabilities to potential employers and collaborators in tangible, accessible ways. GitHub repositories, published Tableau dashboards, case study write-ups, and presentation recordings all serve this purpose. Third, invest in professional community — the analytics ecosystem at conferences like NeurIPS, Strata, and INFORMS, through online communities like Towards Data Science and the r/datascience community, and locally through alumni networks at FAU and industry meetups in South Florida.
It is also worth acknowledging the psychological dimension of working in a field undergoing this level of change. Uncertainty, while intellectually stimulating, can be professionally anxiety-inducing. The most resilient analytics professionals we have observed are those who have internalized the distinction between specific skills and learning ability. Specific skills depreciate; learning ability compounds. Invest in your capacity to learn — your metacognitive skills, your intellectual curiosity, your tolerance for ambiguity — and the specific technical skills will follow as needed.
109.10 The Final Project: Your Analytics Pitch
Figure 10:The Final Project Pitch: a seven-minute presentation that synthesizes your entire ISM 6405 learning journey into a real-world analytics proposal.
10.19.10.1 The Philosophy Behind the Final Project
Throughout this course, you have engaged with analytics through structured exercises, real datasets, and guided frameworks. The Final Project inverts this structure. Rather than applying a given technique to a given problem, you are asked to identify a problem you care about — genuinely, personally — and design an analytics solution for it. This capstone is not a research paper. It is not a data science competition submission. It is a pitch: a persuasive, evidence-grounded, time-constrained argument for why a specific analytics initiative should be pursued.
This format was chosen deliberately. In your professional life, you will rarely have unlimited time to present your analytical work. More often, you will have five minutes in a boardroom, thirty seconds in an elevator, or a single slide in a crowded deck. The ability to communicate analytical value proposition compellingly and concisely is one of the most marketable skills you can develop. The Final Project is your first formal practice at this crucial professional competency.
Dr. Lee’s guiding principle for this project is simple: work on something you would think about even if it weren’t assigned. The best projects in the history of this course have come from students who were frustrated by inefficiencies in their own workplaces, curious about patterns in industries they worked in, or genuinely passionate about solving problems in their communities. Authenticity is detectable — in your energy, in the specificity of your problem framing, in the quality of questions you anticipate. Choose a topic that matters to you.
10.29.10.2 Project Requirements
The Final Project consists of a seven-minute oral presentation pitch delivered during the final class session, followed by a brief Q&A period. The presentation must be accompanied by a slide deck of no more than twelve slides, submitted electronically prior to the final class. The project may be completed individually or in teams of up to three students, with expectations for scope and depth scaled accordingly.
Your pitch must address five core components, which together form the structure of a professional analytics proposal:
Component 1 — The Problem Statement. Clearly define the business, organizational, or social problem you are addressing. Be specific. “Customer churn is expensive” is not a problem statement. “The Southeast regional division of a mid-sized SaaS company is experiencing 28% annual customer churn, approximately double the industry benchmark, concentrated among customers in their second year of subscription, costing an estimated $4.2M in annual recurring revenue” — that is a problem statement. Ground your problem in real data, published statistics, or first-hand organizational knowledge wherever possible.
Component 2 — The Data Strategy. Describe what data you would use to address this problem. What are the primary data sources? Are they internal (transactional systems, CRM records, operational logs) or external (public datasets, purchased data, scraped sources)? What are the key variables? What is the expected data quality situation, and how would you address common issues like missing values, class imbalance, or selection bias? You do not need to have actually collected this data — this is a proposal — but your data strategy must be credible and specific.
Component 3 — The Analytical Methodology. Propose the analytical approach you would employ. Which modeling techniques are most appropriate given the problem structure and data characteristics? Would you use supervised learning, clustering, time-series forecasting, optimization, simulation, causal inference, or some combination? Justify your choices. Identify key assumptions. Describe how you would validate model performance. Explain how the outputs of your model translate into actionable decisions or recommendations.
Component 4 — Expected Impact. Quantify the expected value of your analytics initiative. This is where many student proposals underperform. “This model will help the company make better decisions” is insufficient. “We estimate that a churn prediction model with 80% recall deployed 60 days before renewal would allow the customer success team to intervene with at-risk accounts, conservatively recovering 15% of identified churn and generating approximately 85K” — that is an impact statement. Use assumptions explicitly, show your reasoning, and acknowledge uncertainty ranges.
Component 5 — Implementation Roadmap. Sketch a realistic plan for how this analytics initiative would be executed. What are the key phases? What resources — people, technology, budget — are required? What are the major risks and how would you mitigate them? Who are the key stakeholders, and how would you manage their expectations and engagement? A technically sound proposal that cannot realistically be implemented is an incomplete proposal.
10.39.10.3 Evaluation Criteria
Final Project presentations are evaluated across five dimensions, each weighted equally:
Clarity of Problem Framing assesses whether the problem is specific, significant, and well-defined. Evaluators will ask: do I understand exactly what problem is being solved, and do I believe it matters?
Quality of Analytical Design assesses the appropriateness, rigor, and creativity of the proposed methodology. Evaluators will ask: is this the right analytical approach for this problem, and does the student demonstrate genuine understanding of the methods they are proposing?
Credibility of Impact Estimation assesses the realism and rigor of the value proposition. Evaluators will ask: are the expected benefits plausible, and are the assumptions transparent and defensible?
Communication Effectiveness assesses how well the presentation is structured, paced, visualized, and delivered. Evaluators will ask: is this pitch compelling enough to earn continued attention and investment from a decision-maker with competing priorities?
Handling of Questions assesses depth of understanding and intellectual agility. Evaluators will ask: can this analyst defend their choices, acknowledge limitations honestly, and think constructively under pressure?
10.49.10.4 Advice for an Exceptional Pitch
The presentations that earn the highest evaluations in ISM 6405 share several characteristics that are worth articulating explicitly.
They open with a hook — a striking statistic, a brief story, or a provocative question that immediately communicates why this problem matters. The first thirty seconds of your pitch will determine how much credibility you have earned with your audience by the time you reach your methodology slide.
They demonstrate intellectual honesty. The strongest proposals do not pretend that every technical challenge has been solved or that every assumption is rock-solid. They acknowledge limitations, name the biggest risks, and explain how they would be monitored and managed. Evaluators with domain expertise will see through overconfident claims; they will respect and reward honest uncertainty.
They connect throughout to business value. Every methodological choice, every data source, every model evaluation metric should be connected back to why it matters for the business outcome. “We would use F1-score rather than accuracy as our primary evaluation metric because our dataset is significantly class-imbalanced and the cost of a false negative — failing to identify an at-risk customer — far exceeds the cost of a false positive in this context.” That is the voice of a professional who thinks analytically and commercially simultaneously.
They practice. Seven minutes is simultaneously shorter and longer than most students expect. It is short enough that every slide must earn its place; it is long enough that poor pacing will be obvious. Record yourself presenting at least three times before the final session. Time each run. Adjust. The goal is a presentation that feels natural and confident while covering all five components with appropriate depth.
119.11 Conclusion: The Perpetual Frontier
Analytics has never been a static field. Every era has brought new data sources, new computational capabilities, new theoretical frameworks, and new organizational needs — and every era has found analytics professionals adapting, contributing, and leading. The AI era is not the end of that story. It is the beginning of its most exciting chapter yet.
The trends explored in this chapter — AI-native organizations, augmented analytics, real-time processing, edge computing, responsible AI, emerging frontiers like causal AI and synthetic data — are not distant abstractions. They are live forces shaping job descriptions, investment decisions, and competitive dynamics right now. As you move from ISM 6405 into your careers and continued studies, carry with you not just the technical toolkit this course has built, but the analytical mindset it has cultivated: the habit of questioning assumptions, the discipline of grounding decisions in evidence, the humility to acknowledge what you do not know, and the ambition to keep learning.
The future of analytics belongs to those who show up curious, prepared, and willing to work at the intersection of human judgment and machine intelligence. Based on the work you have done throughout this course, that future belongs to you.
129.12 Discussion Question: The Analytics Leader of 2030
12.19.12.1 Discussion Prompt
In early 2026, the World Economic Forum published its latest Future of Jobs report, projecting that by 2030, approximately 40% of current data analyst job tasks would be automatable using AI tools available today, while simultaneously projecting a 28% increase in demand for “analytical thinking” as a core business competency across all professional roles. The report’s central thesis: AI will not eliminate the need for analytical professionals — but it will radically reshape what those professionals spend their time doing, what skills differentiate top performers from the median, and what organizational roles they occupy.
You are completing your final weeks of ISM 6405, having studied the full arc of business analytics from foundational concepts to the cutting edge of AI, agentic systems, and voice-first interfaces. You are positioning yourself — through your career choices, continued learning, and professional development — for an analytics-intensive career in a world that is changing faster than any prior generation of business professionals has experienced.
Drawing on the concepts and frameworks introduced throughout this course, and particularly on Chapter 9’s discussion of future trends, skills evolution, and the analytics career landscape, critically analyze the following:
The WEF report identifies “analytical thinking” — not coding, not statistical modeling, not data engineering — as the most in-demand capability of the future. How do you interpret this finding in light of what you have learned in this course? Is “analytical thinking” something that can be taught and developed, or is it primarily an innate trait? What specific practices and habits, drawn from this course, would you commit to in order to develop and maintain this capability over the next five years?
Looking at the specific trends covered in Chapter 9 — AI-native organizations, augmented analytics, real-time processing, responsible AI, causal inference, synthetic data — which single trend do you believe will have the greatest impact on the specific industry or functional domain you intend to work in? Justify your position with specific reasoning about that industry’s current state and how the trend will disrupt or transform it by 2030.
This course has argued throughout that human judgment remains indispensable even as AI automates more analytical tasks. Where do you personally draw the line? Are there analytical tasks that you believe should never be fully delegated to AI systems, even if those systems could theoretically perform them with high accuracy? What is the principle underlying your position?
Your response should be 500–700 words and should reflect genuine personal engagement with the material — not a summary of the chapter. This is a final synthesis question; use it to demonstrate the analytical voice and judgment you have developed throughout this course.
12.2📝 Discussion Guidelines
Primary Response: Your initial post must address all parts of the prompt with depth and critical thinking. It must include at least one citation (scholarly or credible industry source) to support your argument.
Peer Responses: You must respond thoughtfully to at least two of your peers. Your responses must go beyond simple agreement (e.g., “I agree with your point”) and add substantial value to the conversation by offering an alternative perspective, sharing related research, or asking a challenging follow-up question.
139.13 Chapter Quiz
Instructions: Answer all 10 questions. This is the final chapter quiz for ISM 6405. Questions draw on the full arc of the course as well as the specific content of Chapter 9.
Question 1 According to the chapter, what distinguishes an “AI-native” analytics organization from a traditional organization that has simply adopted AI tools?
A) AI-native organizations use only open-source AI models rather than commercial platforms
B) AI-native organizations have redesigned their decision-making processes, data infrastructure, and talent strategies around AI capabilities from the ground up, rather than layering AI onto legacy workflows
C) AI-native organizations have eliminated all human analyst roles and rely entirely on automated AI systems for business decisions
D) AI-native organizations are defined by their use of real-time streaming data rather than batch processing
Question 2 True or False: Augmented analytics platforms reduce the need for analytical judgment because the AI surfaces all relevant insights automatically, allowing business users to make better decisions without needing to understand the underlying analytical methods.
Question 3 Which of the following best describes the fundamental challenge that stream processing frameworks like Apache Kafka and Apache Flink address, compared to traditional batch analytics?
A) They allow analytics to be performed on larger datasets than batch systems can handle
B) They enable continuous processing of data as it arrives in real time, reducing latency from hours or days to seconds or milliseconds, which is critical for applications like fraud detection and personalization
C) They eliminate the need for data warehouses by storing all data in memory
D) They provide better data visualization capabilities than traditional ETL tools
Question 4 Explain the concept of “causal AI” as an emerging frontier in analytics. How does causal inference differ from the correlational analysis that dominates most current machine learning systems, and why does this distinction matter for business decision-making?
Question 5 The chapter identifies “responsible AI and governance” as a major trend shaping the future of analytics. Which regulatory development has most significantly shaped the governance obligations of organizations deploying AI analytics systems in 2025–2026?
A) The U.S. Federal AI Accountability Act of 2024, which requires all AI models to be registered with a federal database before deployment
B) The EU AI Act, which establishes a risk-based regulatory framework classifying AI systems by risk level and imposing transparency, documentation, and human oversight requirements for high-risk applications
C) ISO 27001 certification requirements, which now mandate AI model documentation as part of information security audits
D) The GDPR amendment of 2025, which banned the use of AI in all HR and credit decisions in the European Union
Question 6 True or False: Synthetic data — artificially generated datasets that statistically mimic real data — can fully replace real training data in all machine learning applications because it eliminates privacy risks while preserving all the statistical properties of the original data.
Question 7 Describe two specific ways in which edge computing and IoT analytics change the competitive dynamics for a manufacturing company compared to a purely cloud-based analytics architecture. What advantages does edge analytics provide, and what new challenges does it introduce?
Question 8 The chapter argues that “T-shaped” analytics professionals — with deep expertise in one area and broad fluency across adjacent domains — are particularly well-positioned in the AI era. Using your own intended career path as a reference point, describe what your T should look like: what would you choose as your depth dimension, and what breadth dimensions would you cultivate, and why?
Question 9 Which of the following best describes the role of “data storytelling” in the context of final analytics deliverables to senior leadership?
A) Data storytelling means presenting raw data and statistical model outputs directly to executives, trusting them to draw their own conclusions
B) Data storytelling is the discipline of combining data, visuals, and narrative structure to communicate analytical insights in a way that drives understanding and motivates decision-makers to act
C) Data storytelling is primarily a marketing function and is considered outside the scope of technical analytics roles
D) Data storytelling refers to the use of AI-generated natural language narratives to replace all human communication of analytical findings
Question 10 You have completed ISM 6405: Advanced Business Analytics. Looking back across all nine chapters — from descriptive and predictive analytics, through data mining, text mining, visualization, AI’s impact, agentic AI, voice agents, vibe coding, and the future of the field — write a 400-500 word synthesis essay that addresses the following: (a) What is the single most important conceptual insight you take from this course, and how will it shape how you approach analytical work in your career? (b) What capability or skill covered in this course do you believe is most undervalued by the broader business community, and why? (c) If you could add one chapter to this textbook — one topic that you believe belongs in an advanced business analytics course but was not covered — what would it be and why?
149.14 Navigating the Transition: A Practitioner’s Guide to the AI Era
14.19.14.1 The Analyst’s Adaptive Imperative
No generation of analytics professionals has faced a faster pace of change than the current one. The tools, methods, and organizational contexts that define analytics practice in 2026 are substantially different from those that defined it in 2021, and the rate of change shows no signs of slowing. The AI capabilities that feel cutting-edge today — agentic AI systems, multimodal analysis, voice-first analytics interfaces — will likely feel routine within five years, and new capabilities that we cannot fully anticipate are emerging from research labs as you read these words.
This reality places a premium on adaptive capacity — the ability to continuously learn, unlearn, and relearn — as perhaps the most important professional competency for the analytics careers of the 2020s and 2030s. Technical skills acquired today have a shorter half-life than they did a decade ago. The analyst who builds a career entirely on mastery of a specific tool or method without developing the broader analytical judgment to evaluate and adopt new ones will find that career increasingly precarious.
The most resilient analytics careers are being built on a combination of durable capabilities and adaptive skills. Durable capabilities — statistical thinking, causal reasoning, problem structuring, communication of quantitative insight to non-technical audiences, ethical judgment — remain valuable across every generation of tools and every wave of technological change. They are the foundation upon which new technical skills can be continuously layered. Adaptive skills — learning new tools quickly, evaluating emerging technologies critically, translating between business problems and analytical methods — determine how fast and effectively each new layer can be added.
14.29.14.2 The 2025 Analytics Technology Stack: What Every Analyst Should Know
The technology landscape for business analytics has never been richer — or more potentially overwhelming. Understanding what tools matter, what they are for, and which to prioritize learning is itself a strategic skill. Below is an opinionated assessment of the 2025 analytics technology stack based on industry deployment patterns, job market demand, and expected durability.
Tier 1 — Non-Negotiable Core:
Python (with pandas, scikit-learn, and the PyData ecosystem): The lingua franca of data science and ML engineering. No serious analytics professional in 2025 can afford illiteracy in Python.
SQL: Despite decades of predictions about its replacement, SQL remains the most-used language in the analytics profession and the primary interface for the modern data warehouse. Advanced SQL — window functions, CTEs, query optimization — distinguishes senior analysts from junior ones.
Cloud Data Platform (Snowflake, BigQuery, or Databricks): One of the three leading cloud data warehouses is present in the data stack of virtually every data-mature organization. Hands-on proficiency with at least one is essential.
AI Prompt Engineering: The ability to design, iterate, and evaluate prompts for large language models has become a core analytics skill in a world where LLM-powered tools are embedded throughout the analytics workflow.
Tier 2 — High Value, Broadly Applicable:
A data visualization tool (Tableau, Power BI, or Looker): Fluency in at least one industry-standard visualization platform is expected for most analytics roles.
Git and version control: Managing analytical code and models with version control is a professional standard, not an optional advanced skill.
dbt (data build tool): The transformation layer of the modern data stack. dbt fluency signals data engineering competence that distinguishes analytics engineers from pure data analysts.
A vector database or semantic search tool: As RAG architectures become standard for enterprise AI applications, familiarity with vector databases (Pinecone, Weaviate, pgvector) is increasingly valuable.
Tier 3 — Specialized but Strategic:
Apache Spark or Flink: For large-scale data processing and streaming analytics. Essential for data engineering-heavy roles.
MLOps platforms (MLflow, Weights & Biases, SageMaker): For roles focused on ML model productionization and governance.
Causal inference tools (DoWhy, EconML, CausalML): For senior analytics roles where rigorous impact measurement and decision analysis are required.
14.39.14.3 Building Your Personal Brand in Analytics
The analytics job market of 2025 rewards professionals who have made their work visible. In a field where many practitioners work on proprietary internal data and cannot share their actual project outputs, building credibility through publicly demonstrable work has become an important differentiator.
Maintain an active GitHub portfolio. Recruiters and hiring managers at analytics-forward organizations routinely examine candidates’ GitHub profiles as part of the screening process. A portfolio of well-documented, thoughtfully structured projects — even relatively simple analyses on public datasets — demonstrates the habits of mind (clean code, good documentation, reproducibility) that distinguish professional analysts from self-taught hobbyists.
Write about analytics. Publishing analytical thinking through blogs (Substack, Medium), LinkedIn articles, or conference presentations builds both credibility and clarity. The discipline of explaining an analytical concept or project to a general audience forces a level of understanding that internal presentations rarely require. Many of the most influential practitioners in the analytics field first gained visibility through their written explanations of techniques and tools.
Engage with the analytics community. The data science and analytics community is remarkably open and collaborative. Contributing to open-source projects, answering questions on Stack Overflow and Cross Validated, engaging in data science competitions on Kaggle, and participating in local and online analytics communities all build networks and credibility simultaneously.
Pursue targeted credentials. While no credential substitutes for demonstrated skill, several carry genuine market signal in the analytics job market: the Google Professional Data Analytics Certificate for foundational credibility, the AWS Machine Learning Specialty or Google Professional ML Engineer for cloud AI specialization, the Certified Analytics Professional (CAP) for senior practitioners seeking vendor-neutral credentials, and graduate degrees (MBA with analytics concentration, MS in Data Science, or MS in Business Analytics) for significant career acceleration.
14.49.14.4 The Long View: Analytics as a Career, Not a Job
The most satisfying analytics careers we observe in 2025 share a common characteristic: they are careers defined by a commitment to using evidence to make better decisions — not careers defined by mastery of any particular tool or method. The tools will change. The methods will evolve. But the fundamental value proposition of analytics — replacing guesswork with evidence, intuition with insight, convention with measurement — is as durable as human organizational life.
The students who came through ISM 6405 in earlier cohorts are now analytics directors, chief data officers, founders of analytics startups, and leaders of AI transformation programs at major corporations. What they share is not proficiency in any specific technology — most of the tools they used when they first learned analytics no longer exist in their original form. What they share is the analytical mindset: the habit of asking “how do we know?”, the discipline of checking their assumptions, the willingness to follow the evidence even when it leads somewhere uncomfortable, and the ability to communicate what the numbers mean to the people who need to act on them.
That mindset is what this course has been building. The tools are where you started. The mindset is what you carry forward.
159.15 The Analytics Profession in 2026: A Snapshot
15.19.15.1 Job Market Realities
The analytics job market in 2026 presents a fascinating contradiction. Overall, demand for analytically skilled professionals has never been higher — virtually every sector of the economy has absorbed the lesson that data-driven decision-making is a competitive imperative, and the infrastructure to support it requires substantial human talent to build, manage, and interpret. The U.S. Bureau of Labor Statistics’ Occupational Outlook Handbook projects 35% growth in data scientist roles through 2030, far outpacing the average for all occupations.
Yet within this buoyant overall market, significant disruption is visible at the task and role level. Routine analytical tasks — producing standard reports, running basic descriptive statistics, building simple dashboards — are being automated at an accelerating rate by AI tools. The analyst who spends 70% of their time on these tasks faces genuine displacement risk. The analyst who uses AI to complete those tasks in 10% of the time — and spends the remaining 90% on judgment-intensive, stakeholder-facing, problem-framing work — commands premium compensation and growing influence.
The specific roles growing fastest in the 2025-2026 analytics job market include:
Analytics Engineering — the discipline of building reliable, tested, documented data transformation pipelines using tools like dbt. Analytics engineers sit at the intersection of data engineering and analytics, and their work makes data accessible and trustworthy for the rest of the analytics organization. The role has grown from essentially nonexistent in 2018 to a distinct and well-compensated discipline in the modern data stack era.
AI Governance and Responsible Analytics — compliance, ethics, and risk management roles specific to AI and ML systems. The EU AI Act, emerging U.S. state AI legislation, and sector-specific guidance from financial regulators have created genuine demand for professionals who understand both AI technical capabilities and regulatory requirements. This role did not exist as a recognized job category five years ago.
Decision Science — the application of behavioral science, causal inference, and decision analysis to improve organizational decision-making quality. Decision scientists go beyond descriptive analysis to ask: how should this organization make decisions given what the data shows, and what cognitive biases or organizational incentives are preventing optimal decision behavior? The discipline draws on economics, psychology, statistics, and management science.
Conversational AI and Agent Design — as organizations deploy LLM-powered agents for analytics, customer service, and internal knowledge management, there is growing demand for professionals who can design, evaluate, and govern these systems. This role requires a blend of NLP knowledge, UX design thinking, and analytics domain expertise.
15.29.15.2 Compensation Trends
The analytics compensation landscape in 2026 reflects the premium on senior judgment and the commoditization of routine tasks. Entry-level data analyst roles in most U.S. markets command 90,000 annually — slightly lower in inflation-adjusted terms than peak 2021-2022 compensation as supply of entry-level analysts increased with the proliferation of data science bootcamps and university programs.
Senior data scientists and analytics engineers in major tech markets earn 250,000 in total compensation. Specialized roles — AI governance leads, decision scientists, principal ML engineers at top-tier firms — regularly command $300,000+ in total compensation packages. The most significant compensation growth is occurring for hybrid professionals who combine deep technical skills with genuine business domain expertise and stakeholder communication skills — the “full-stack analyst” archetype that can independently identify business problems, design analytical solutions, execute them technically, and communicate findings persuasively.
15.39.15.3 The Global Analytics Landscape
Analytics capability and talent are distributed globally in ways that have significant implications for career strategy and organizational analytics investment.
India continues to be the world’s largest supplier of analytics talent by volume, with a robust ecosystem of engineering universities, analytics-focused graduate programs, and service firm training operations producing tens of thousands of analytics professionals annually. The quality distribution is wide — India produces some of the world’s best analytics researchers and practitioners, alongside a much larger volume of analysts trained primarily on process execution rather than independent problem-solving.
Europe’s analytics talent market has been transformed by the EU AI Act and GDPR regime. Organizations operating in Europe face regulatory requirements that have created demand for analytically trained compliance and governance professionals that did not previously exist. European universities have responded with specialized programs in responsible AI, AI ethics, and data governance that are beginning to produce a distinctive flavor of analytics professional focused as much on risk management as on capability building.
Latin America’s analytics market is growing rapidly, driven by technology sector expansion in Brazil, Colombia, and Mexico, and by the growing deployment of analytics tools in retail, financial services, and agriculture. The region’s large Spanish and Portuguese-speaking populations have historically been underserved by NLP tools trained predominantly on English data — a gap that multilingual model advances are rapidly closing, creating new analytics applications in these markets.
China has invested heavily in AI and analytics infrastructure at both the governmental and commercial level. Chinese technology companies like Alibaba, Tencent, Baidu, and ByteDance have built world-class analytics capabilities, though these capabilities are largely deployed within the Chinese market. The geopolitical bifurcation between Chinese and Western AI ecosystems — with separate model development, regulatory regimes, and data infrastructure — is a structural feature of the global analytics landscape that will define career and organizational strategy for the foreseeable future.