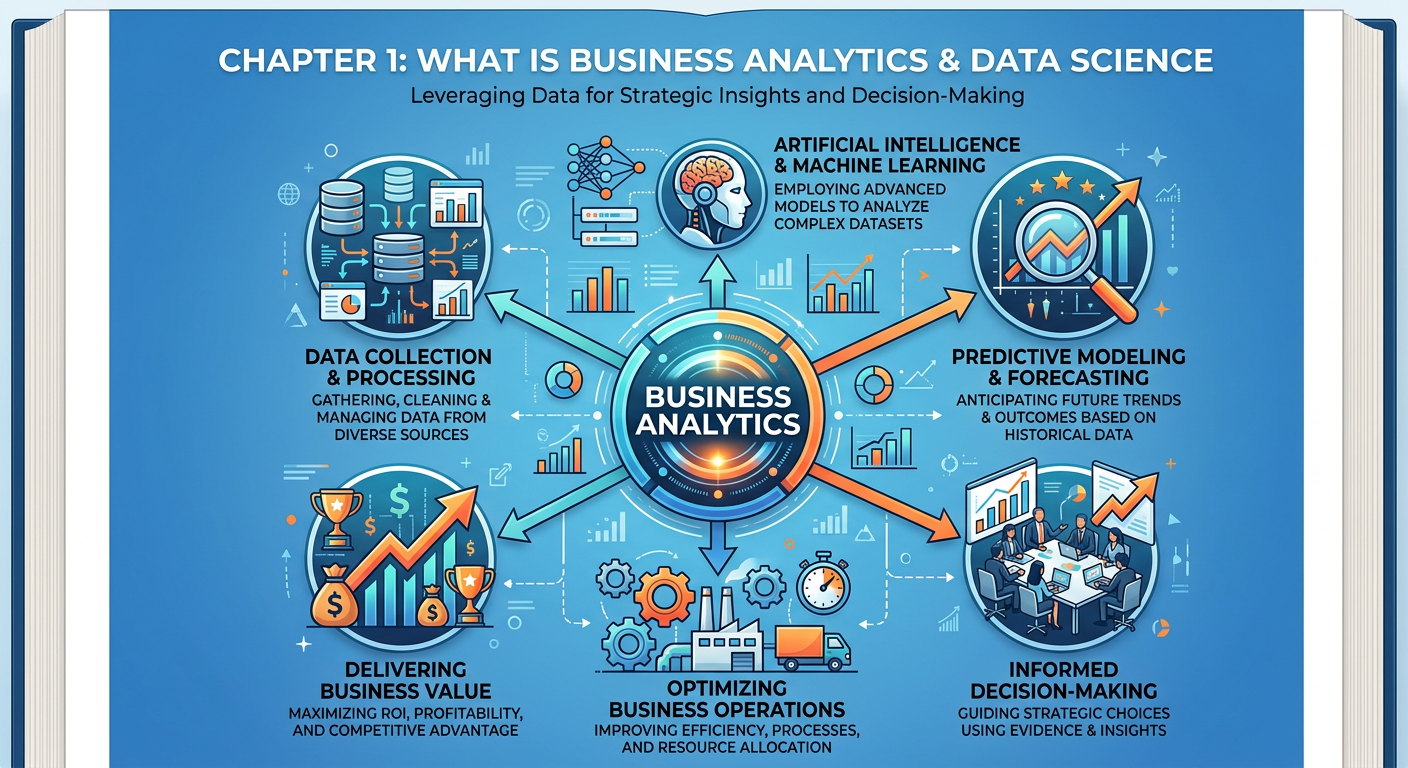
Figure 1:Explainer Infographic: Chapter 1: What is Business Analytics and Data Science.
1Welcome to the Age of Data-Driven Decisions
Imagine you are the Chief Marketing Officer of a mid-sized retail chain. Your holiday season campaign is about to launch and you have a budget of $2 million to allocate across digital ads, email marketing, in-store promotions, and social media influencers. In the past, decisions like this were made largely on intuition — what worked last year, what the team felt confident about, what the industry was buzzing about. Today, you have access to terabytes of customer transaction data, web clickstreams, loyalty program records, competitor pricing feeds, and social sentiment scores. The question is no longer whether data can help you make this decision — it absolutely can. The real question is: do you have the analytical capability to turn that data into a winning strategy?
This is precisely why you are here. Welcome to ISM 6405: Advanced Business Analytics, a course designed to equip you with the concepts, tools, and applied skills needed to transform raw data into strategic business value. In this opening chapter, we lay the intellectual and practical foundation for everything that follows. We define what business analytics actually means, explore how it differs from — and overlaps with — data science, examine the ecosystem of roles and tools that make up the modern analytics enterprise, and discuss why the rise of artificial intelligence (AI) has fundamentally changed the rules of the game.
By the end of this chapter, you will not just understand the vocabulary of analytics and data science — you will be able to articulate why these capabilities matter, how organizations deploy them, and how you, as a future business leader or analyst, fit into this rapidly evolving landscape.
21.1 The Data Revolution: Context and Scale
Before defining terms, it is worth stepping back to appreciate the sheer magnitude of what has happened to data over the past two decades. According to IDC, the global datasphere — the total volume of data created, captured, copied, and consumed worldwide — surpassed 120 zettabytes in 2023 and is projected to exceed 180 zettabytes by 2025. To put that in perspective, more data has been generated in the last five years than in all of prior human history combined. The proliferation of generative AI systems alone has dramatically accelerated both data production and data consumption. This explosion is driven by a convergence of forces: the proliferation of smartphones and IoT (Internet of Things) devices, the migration of commerce and communication to digital platforms, the expansion of cloud computing infrastructure, and more recently, the deployment of generative AI systems that both consume and produce enormous quantities of information.
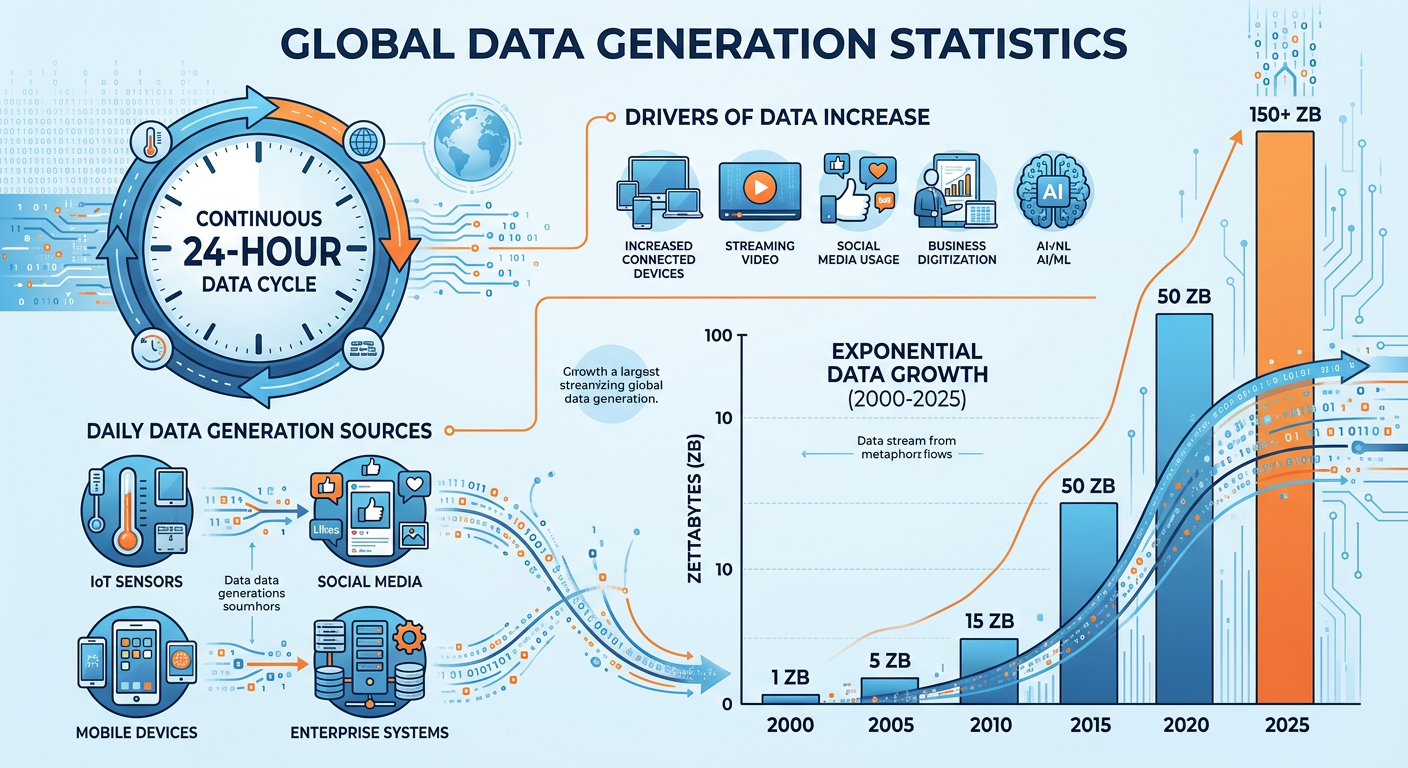
Figure 2:The Exponential Growth of Global Data Volume (2010–2030). Source: IDC Global DataSphere.
For businesses, this data explosion is both an opportunity and a challenge. The opportunity: organizations that can effectively analyze and act on data enjoy measurable competitive advantages. McKinsey Global Institute research consistently shows that data-driven organizations are 23 times more likely to acquire customers, six times as likely to retain customers, and 19 times more likely to be profitable. The challenge: the volume, velocity, variety, and veracity of data — often called the Four V’s of Big Data — make it increasingly difficult to manage, process, and extract insight without specialized skills and tools.
This is the world that business analytics and data science were built for.
31.2 Defining Business Analytics
The term “business analytics” is used in a variety of ways in industry and academia, which can create confusion. Let us establish a precise, working definition.
Notice a few key elements in this definition. First, business analytics is iterative — it is not a one-time exercise but an ongoing cycle of asking questions, gathering data, building models, testing hypotheses, and refining. Second, it emphasizes methodical exploration — this is disciplined, structured inquiry, not random exploration. Third, it exists for a purpose: to improve business performance, whether that means increasing revenue, reducing costs, improving customer satisfaction, managing risk, or optimizing operations.
The analytics landscape is typically organized into four progressive levels, often visualized as a staircase or maturity model, each level answering a more complex and valuable question.
3.11.2.1 Descriptive Analytics: What Happened?
Descriptive analytics is the foundation of all analytical work. It involves summarizing historical data to understand what has occurred in the past. This is the world of dashboards, reports, KPIs (Key Performance Indicators), and data visualization. When a retail manager reviews last week’s sales report by product category, or when a hospital tracks its 30-day patient readmission rate over the past year, they are engaging in descriptive analytics.
Descriptive analytics is not simplistic — well-designed descriptive systems can surface patterns and anomalies that would otherwise go unnoticed. A carefully constructed executive dashboard that shows sales performance across regions, broken down by product line, customer segment, and time period, can prompt questions that lead to significant strategic insight. Tools like Tableau, Microsoft Power BI, Google Looker Studio, and even well-structured Excel workbooks are the workhorses of descriptive analytics.
However, descriptive analytics alone answers only the what — not the why, the so what, or the what next. That requires moving up the staircase.
3.21.2.2 Diagnostic Analytics: Why Did It Happen?
Diagnostic analytics digs deeper to understand the causes of observed events. If a company’s customer churn rate increased by 15% in Q3, descriptive analytics tells you that it happened. Diagnostic analytics asks: why? This might involve drill-down analysis, data mining, correlation studies, root cause analysis, and hypothesis testing.
For example, a diagnostic analysis might reveal that the churn spike was concentrated among customers who had interacted with a specific customer service team, or who had purchased a product that received a batch of defective units, or who were acquired through a promotional channel that tends to attract low-loyalty buyers. These insights explain the phenomenon and point toward potential corrective action.
3.31.2.3 Predictive Analytics: What Will Happen?
Predictive analytics uses historical data and statistical or machine learning models to forecast future outcomes. This is where the field starts to require more sophisticated quantitative skills — regression models, time series forecasting, classification algorithms, neural networks, and ensemble methods are all tools of the predictive analyst.
Classic applications include: credit scoring (will this loan applicant default?), demand forecasting (how many units will we sell next month?), churn prediction (which customers are likely to cancel their subscription?), fraud detection (is this transaction anomalous?), and equipment failure prediction (which assets are likely to need maintenance in the next 30 days?). Amazon’s famous product recommendation engine — responsible for an estimated 35% of total revenue — is one of the most commercially successful predictive analytics systems ever built.
3.41.2.4 Prescriptive Analytics: What Should We Do?
Prescriptive analytics is the frontier of the field. It goes beyond prediction to recommend specific actions and, in many cases, to automate decision-making. Prescriptive methods include optimization algorithms, simulation models, reinforcement learning, and decision support systems.
Consider airline revenue management: an airline’s pricing algorithm doesn’t just predict demand for a given flight — it continuously prescribes price adjustments across thousands of fare classes to maximize total revenue, accounting for competitor pricing, booking velocity, seat availability, and customer segment behavior. This is prescriptive analytics at scale.
The rise of AI, and particularly large language models (LLMs) and autonomous agents, is dramatically expanding the scope and accessibility of prescriptive analytics. Tools like Google’s Gemini, OpenAI’s GPT-4, and Anthropic’s Claude can now assist analysts in writing code, interpreting outputs, generating hypotheses, and even presenting recommendations in natural language — collapsing the time between raw data and actionable insight.
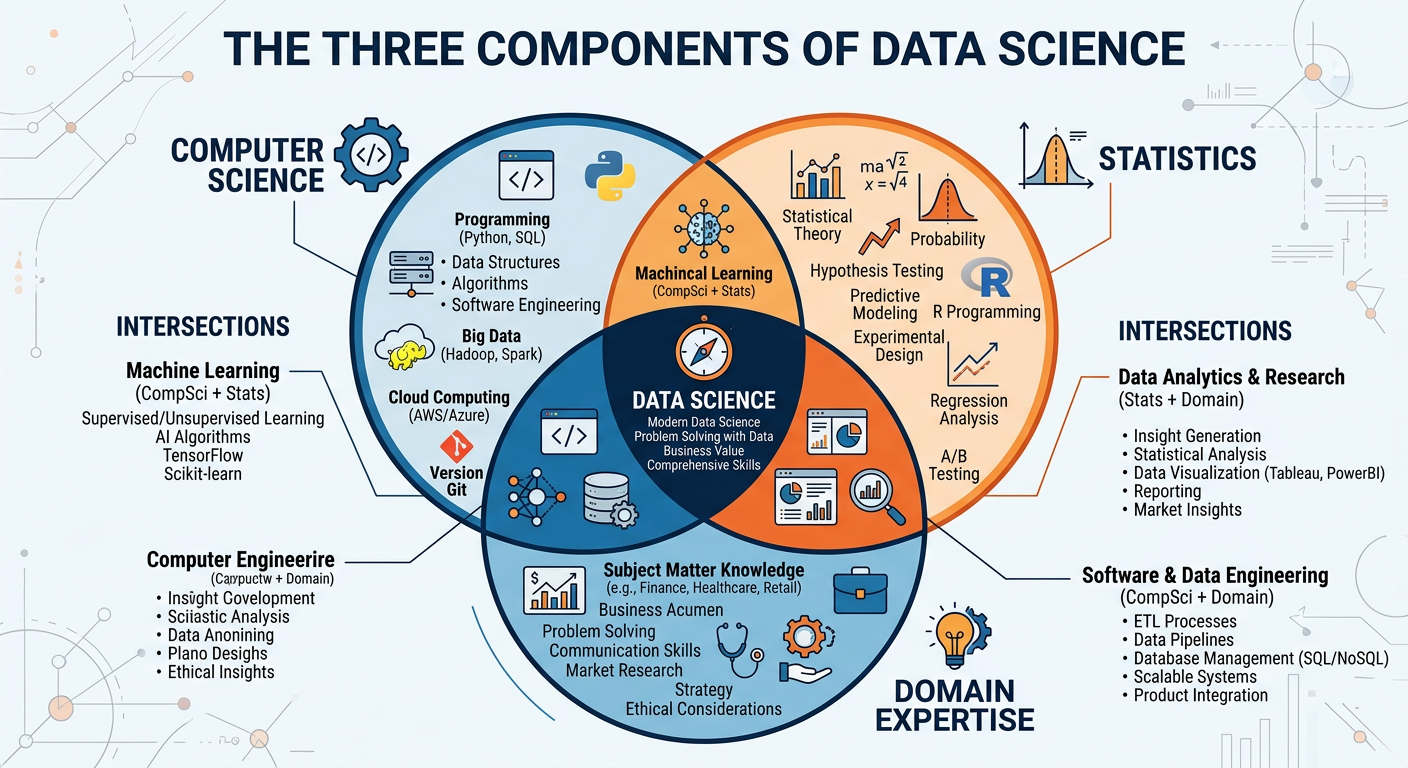
Figure 3:The Four Levels of Business Analytics: From Descriptive to Prescriptive.
41.3 Defining Data Science
If business analytics is a well-established field with roots in operations research, management information systems, and statistics, data science is a newer, somewhat more ambiguous discipline that emerged from the intersection of computer science, statistics, and domain expertise. The term was popularized in the mid-2000s by figures like DJ Patil (who served as the first U.S. Chief Data Scientist) and Jeff Hammerbacher (one of Facebook’s early data engineering pioneers), though its intellectual roots go back decades.
Drew Conway’s famous Venn diagram, published in 2010, remains one of the most cited representations of what data science involves: it sits at the intersection of hacking skills (the ability to collect, process, and manipulate data programmatically), math and statistics knowledge (the ability to model data rigorously), and substantive expertise (deep understanding of the domain or business context). Conway’s original diagram placed the intersection of hacking skills and statistics without domain expertise in the “danger zone” — technically capable but potentially producing misleading results due to a lack of business context.
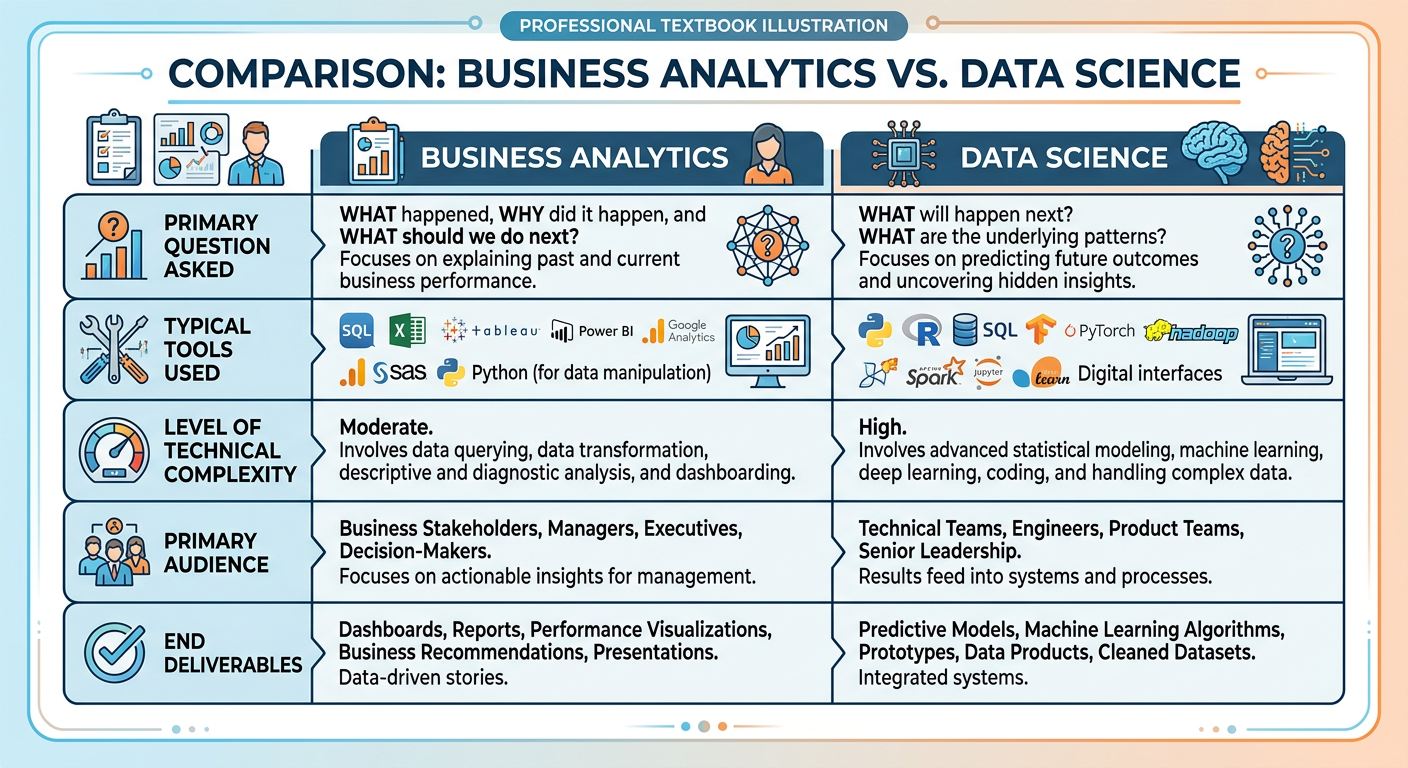
Figure 4:The Drew Conway Data Science Venn Diagram: Core Competency Areas.
Data science projects typically follow a structured lifecycle. The most widely used framework is the CRISP-DM model (Cross-Industry Standard Process for Data Mining), which consists of six phases: Business Understanding, Data Understanding, Data Preparation, Modeling, Evaluation, and Deployment. More recently, teams have adopted agile and iterative approaches, but the core logic remains the same: understand the problem, understand the data, prepare and clean the data, build models, evaluate them rigorously, and deploy them into production.
51.4 Business Analytics vs. Data Science: Clearing Up the Confusion
Students new to this field frequently ask: are business analytics and data science the same thing? The honest answer is: they overlap significantly, but they are not identical. Understanding the differences — and the connections — will help you navigate career paths, communicate with colleagues, and scope projects more effectively.
Primary Focus: Decision support and business improvement.
Key Question: How can data help us make better business decisions?
Typical Methods: Statistical analysis, data visualization, dashboards, regression, forecasting, optimization.
Primary Stakeholders: Business managers, executives, operations teams.
Tools: Excel, Tableau, Power BI, SAS, R, Python (pandas, statsmodels).
Typical Deliverable: Insight reports, dashboards, recommendation memos, optimization models.
Time Horizon: Often near-term and operationally focused.
Primary Focus: Knowledge discovery, model building, and system creation.
Key Question: What patterns and predictions can we extract from complex data at scale?
Typical Methods: Machine learning, deep learning, natural language processing, computer vision, A/B testing, causal inference.
Primary Stakeholders: Product teams, engineering teams, research teams.
Tools: Python (scikit-learn, TensorFlow, PyTorch), Spark, SQL, cloud platforms (GCP, AWS, Azure), MLOps tools.
Typical Deliverable: Trained models, data pipelines, APIs, research findings.
Time Horizon: Often medium-to-long term; system-building oriented.
Both fields:
Rely on statistical foundations and quantitative reasoning.
Use programming (particularly Python and SQL) as core technical tools.
Require strong data wrangling and cleaning skills.
Emphasize communication of results to non-technical audiences.
Operate within the ethical and regulatory constraints around data privacy.
Are increasingly augmented by AI and large language models.
In practice, many organizations use the terms interchangeably, and many professionals develop competencies in both areas. The boundary is porous — and that is a good thing.
61.5 The Analytics Ecosystem: Roles, Teams, and Organizations
Modern analytics is rarely a solo endeavor. It is an ecosystem of interconnected roles, each contributing a different kind of expertise to the collective mission of making an organization more data-driven. Understanding this ecosystem is essential for working effectively within it.
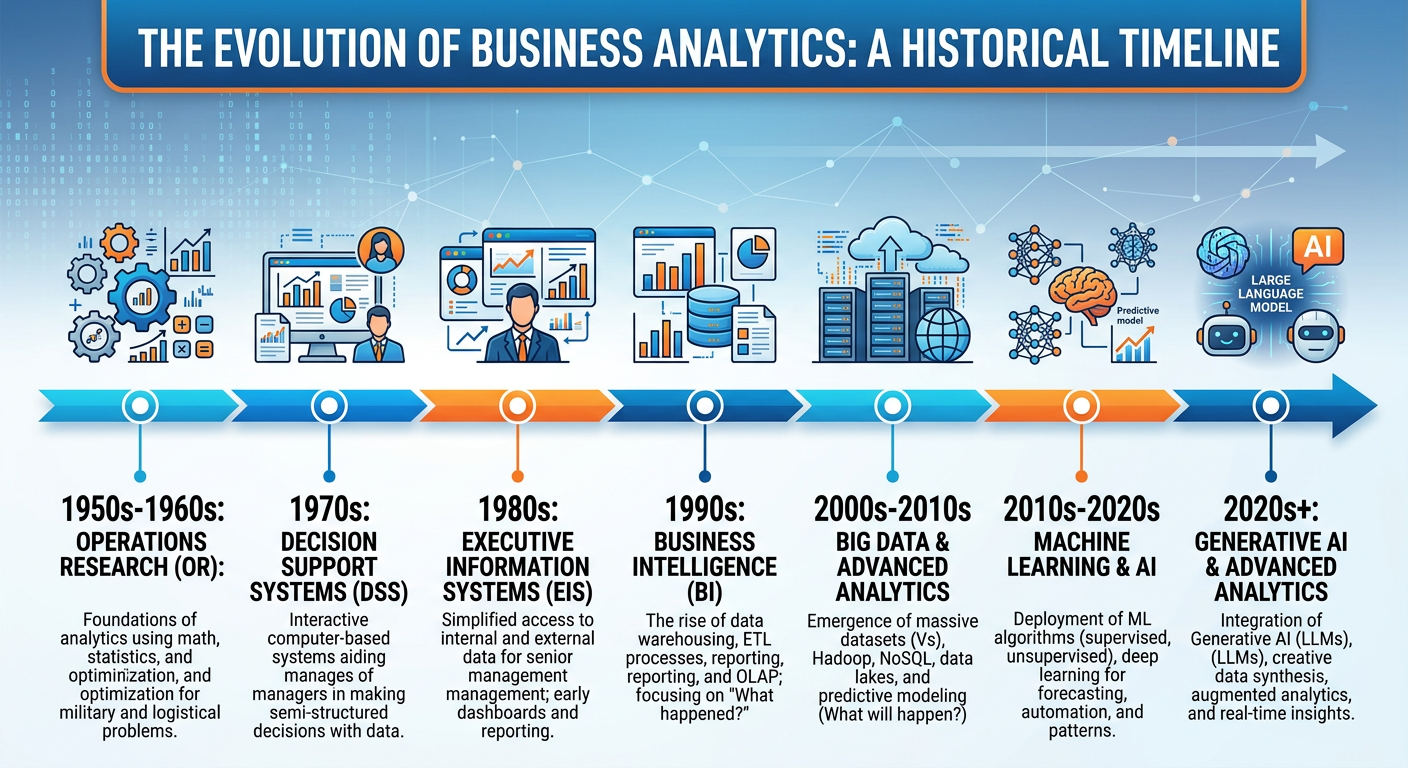
Figure 5:Anatomy of a Modern Data and Analytics Organization.
6.11.5.1 Key Roles in the Analytics Ecosystem
Data Analyst: The data analyst is often the workhorse of an analytics team. Their primary responsibility is to query, clean, aggregate, and visualize data to answer specific business questions. Analysts typically work closely with business stakeholders, translating questions like “why are our Northeast stores underperforming?” into SQL queries, Python scripts, or dashboard configurations that produce actionable answers. Strong SQL skills, proficiency with visualization tools, and excellent communication skills are the hallmarks of a great data analyst.
Data Scientist: The data scientist builds predictive and explanatory models — the statistical and machine learning systems that power recommendations, forecasts, and automated decisions. They spend significant time on data preparation (often cited as consuming 60-80% of a project’s time), feature engineering, model selection, and evaluation. Data scientists typically have graduate-level training in statistics, computer science, or a quantitative field, combined with strong programming skills in Python or R.
Data Engineer: If data scientists are the builders, data engineers are the infrastructure team. They design and maintain the pipelines, databases, and processing systems that move data from its sources (transaction systems, APIs, sensors, third-party feeds) to the places where analysts and scientists can work with it. Data engineers are masters of tools like Apache Spark, Kafka, dbt, Airflow, and cloud data warehouses like Snowflake, BigQuery, or Redshift.
Machine Learning Engineer (ML Engineer): The ML engineer bridges the gap between data science and software engineering. Where a data scientist might build a model in a Jupyter notebook, the ML engineer is responsible for deploying that model into production — building the serving infrastructure, monitoring its performance over time, retraining it when it degrades, and ensuring it operates reliably at scale. MLOps (Machine Learning Operations) is the discipline that formalize these practices.
Analytics Translator / Analytics Manager: This role — sometimes called the “analytics translator” — is arguably the most critical and underappreciated in the ecosystem. The analytics translator works at the interface between the technical team and business stakeholders, ensuring that analytical work is correctly scoped, interpreted, and acted upon. They must speak both languages: business strategy and data science. McKinsey estimates that the United States alone will need 200,000 analytics translators over the next decade.
Chief Data Officer (CDO): The CDO is the executive responsible for the organization’s data strategy — ensuring that data is treated as a strategic asset, that governance and quality standards are maintained, that privacy regulations are complied with, and that the analytics function is aligned with business priorities.
6.21.5.2 The Analytics Maturity Model
Not all organizations are at the same stage of analytics capability. The Analytics Maturity Model describes a progression from basic, ad-hoc reporting to a fully optimized, AI-powered, data-driven organization.
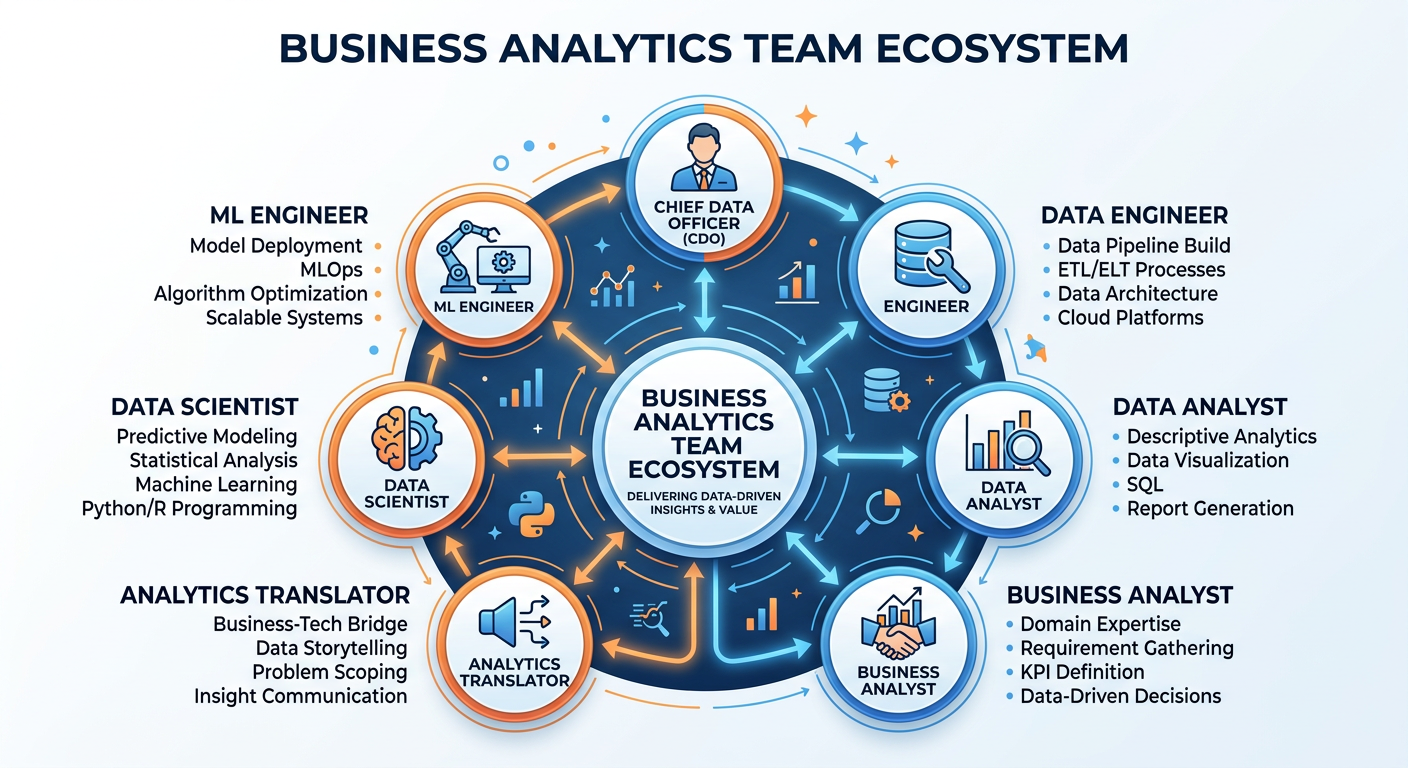
Figure 6:The Analytics Maturity Model: Five Stages of Organizational Capability.
Research by Gartner and TDWI suggests that the majority of organizations are still at Stages 1 or 2 — relying primarily on descriptive reporting with limited predictive capability. Only a small fraction of companies — typically large technology firms, financial institutions, and leading consumer brands — have reached Stages 4 or 5. This gap represents an enormous opportunity for analytically skilled professionals who can help organizations move up the maturity curve.
71.6 The Technology Stack: From Spreadsheets to AI Platforms
The tools available to analysts and data scientists have evolved dramatically over the past decade. Understanding the landscape of technologies helps you make informed choices about which tools to learn and apply.
Figure 7:The Modern Data Analytics Technology Stack: From Raw Data to AI-Powered Insight.
7.11.6.1 Spreadsheets and BI Tools
Microsoft Excel and Google Sheets remain the most widely used analytical tools in business, used by hundreds of millions of people worldwide. For many business analytics tasks — scenario modeling, pivot table analysis, basic statistical calculations, and structured reporting — spreadsheets are entirely adequate. The mistake is using them for tasks they are not designed for: managing millions of rows, version-controlling complex models, or collaborating across large teams.
Business Intelligence (BI) tools like Tableau, Microsoft Power BI, Looker, and Qlik connect directly to enterprise data warehouses and allow analysts to build interactive dashboards and reports without writing code. These tools have dramatically democratized data access within organizations, enabling business users to explore data independently rather than submitting tickets to a central IT team.
7.21.6.2 Programming Languages: Python and R
Python has become the dominant language for data science and analytics, thanks to its clean syntax, extensive library ecosystem, and versatility across the entire analytics stack — from data wrangling (pandas) and statistical analysis (statsmodels, scipy) to machine learning (scikit-learn) and deep learning (TensorFlow, PyTorch). Python’s broad adoption in software engineering also means that data science models can be seamlessly integrated into production applications.
R remains widely used in academia and in industries where statistical rigor is paramount, particularly in biostatistics, clinical research, and economics. R’s ggplot2 library is widely regarded as the gold standard for statistical data visualization.
For this course, we will use Python as our primary programming environment, delivered through Google Colab — a free, cloud-based Jupyter notebook environment that requires no installation and integrates natively with Google Drive and Google’s AI tools, including the Gemini API.
7.31.6.3 SQL and Data Warehousing
Structured Query Language (SQL) is arguably the most universally useful skill in the analytics profession. Despite being over 50 years old, SQL remains the primary language for querying relational databases, and modern cloud data warehouses like Snowflake, Google BigQuery, Amazon Redshift, and Databricks SQL have made SQL even more relevant by enabling it to query petabytes of data at cloud scale.
Every analyst and data scientist is expected to be proficient in SQL. In surveys of hiring managers, SQL consistently ranks as the number-one technical skill sought in analytics candidates.
7.41.6.4 Cloud Computing and MLOps
The major cloud providers — Google Cloud Platform (GCP), Amazon Web Services (AWS), and Microsoft Azure — have become the infrastructure backbone of modern analytics. They provide managed services for data storage, data processing, model training, model serving, and AI APIs that allow organizations to deploy sophisticated analytics capabilities without building on-premises infrastructure.
MLOps — the set of practices for deploying, monitoring, and maintaining machine learning models in production — has emerged as a critical discipline as organizations move from building models in research notebooks to running them as live business systems.
7.51.6.5 AI and Large Language Models
The most transformative development in the analytics ecosystem over the past several years has been the rise of generative AI and large language models (LLMs). Models like Google’s Gemini 2.0 Flash/Pro, OpenAI’s GPT-4o and o3, and Anthropic’s Claude Sonnet 4.5 are capable of writing and explaining code, conducting web research, summarizing documents, building data analysis workflows, and generating natural-language explanations of statistical results.
For business analysts and data scientists, these tools serve as powerful force multipliers — dramatically accelerating tasks that previously required specialized expertise or significant time investment. In this course, we will integrate Gemini throughout our hands-on activities, treating it as a collaborative analytical assistant rather than a replacement for critical thinking.
81.7 Real-World Applications: Analytics Across Industries
One of the most compelling aspects of business analytics and data science is their universality. Every industry, every function, every organization of meaningful scale has opportunities to apply these methods. Let us survey several domains to build intuition for the breadth of application.
8.11.7.1 Retail and E-Commerce
Retail is perhaps the industry where analytics has been most visibly transformative. Amazon’s entire operating model is built on analytics: from dynamic pricing algorithms that adjust prices millions of times per day, to its recommendation engine, to its supply chain optimization systems that predict what products will be needed in which fulfillment centers weeks in advance. Walmart, Target, and other large retailers invest billions in analytics infrastructure, using loyalty data, point-of-sale transactions, and supply chain data to optimize everything from shelf placement to promotional pricing.
8.21.7.2 Financial Services
Banks and financial institutions have used quantitative methods for decades — credit scoring, risk modeling, and fraud detection are mature analytics disciplines. Today, the frontier includes real-time transaction fraud detection using deep learning (Mastercard processes over 160 billion transactions annually and uses AI to flag fraud in milliseconds), algorithmic trading, personalized financial advice through robo-advisors, and regulatory stress testing.
8.31.7.3 Healthcare
Healthcare analytics has the potential to save lives at scale. Applications include clinical decision support (using patient data to alert clinicians to medication interactions or deteriorating conditions), hospital resource optimization (predicting patient census to staff efficiently), readmission risk modeling (identifying high-risk patients for intervention), drug discovery (using AI to identify promising molecular compounds), and public health surveillance (detecting disease outbreaks from aggregated data patterns).
8.41.7.4 Marketing and Customer Experience
Marketing analytics enables organizations to segment customers with precision, personalize communications at individual level, measure campaign ROI rigorously, and optimize the customer journey across multiple touchpoints. Attribution modeling, lifetime value prediction, A/B testing, and multi-touch campaign analytics are foundational tools for modern marketing teams.
8.51.7.5 Supply Chain and Operations
Supply chain analytics addresses some of the most complex optimization problems in business — balancing inventory costs against service levels, routing delivery vehicles efficiently, predicting equipment failures before they cause downtime, and optimizing production schedules. The COVID-19 pandemic’s disruption of global supply chains dramatically heightened executive awareness of the need for advanced supply chain analytics capabilities.
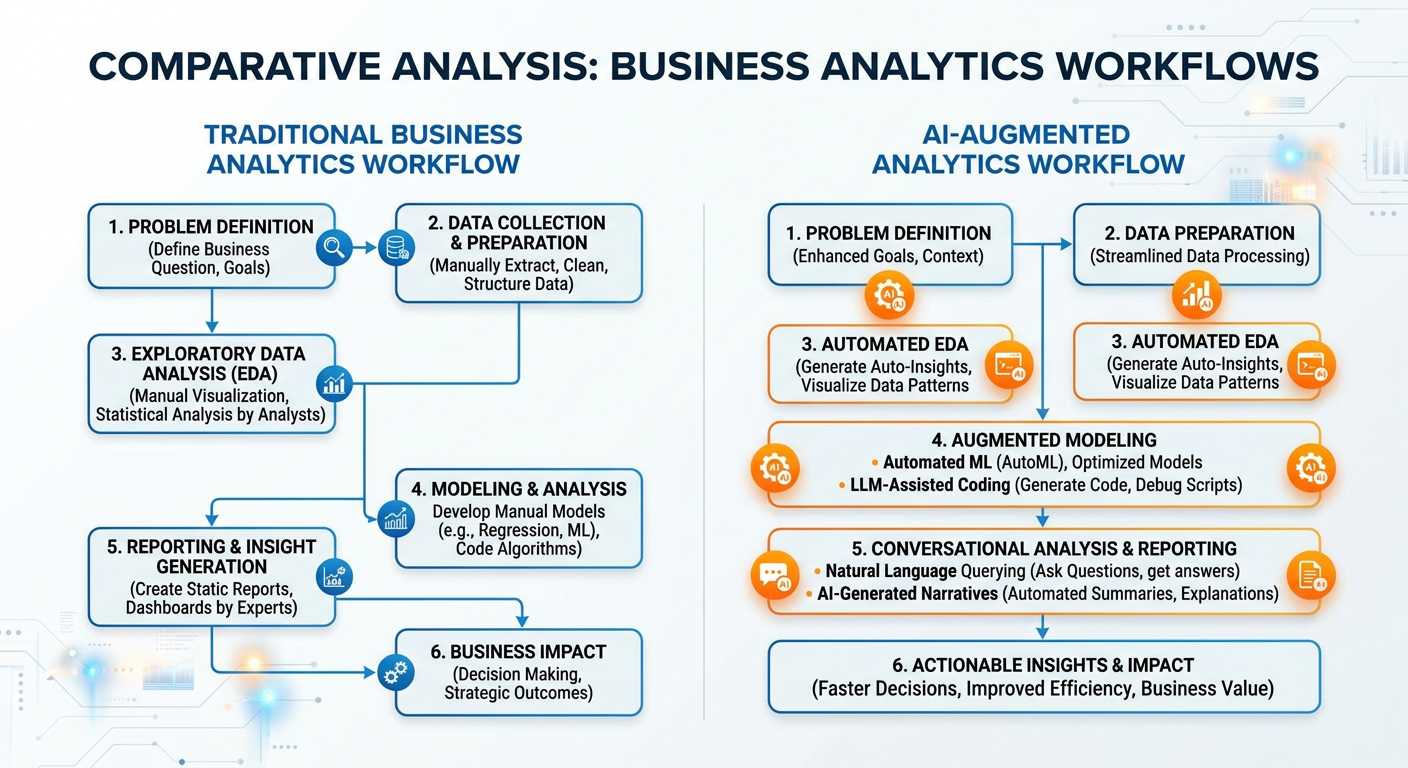
Figure 8:Business Analytics Applications Across Industry Sectors.
91.8 Ethics, Privacy, and Responsible Analytics
No introduction to business analytics and data science would be complete without a serious discussion of ethics. As analytical capabilities grow more powerful and data collection becomes more pervasive, the potential for harm — through bias, privacy violation, manipulation, and unintended consequences — grows in parallel.
9.11.8.1 Algorithmic Bias
Machine learning models learn patterns from historical data. When that historical data reflects past discrimination — in hiring, lending, criminal justice, or healthcare — models trained on it can perpetuate and even amplify those biases at scale. Amazon famously scrapped an AI recruiting tool in 2018 after discovering it systematically downgraded resumes from women. COMPAS, a recidivism prediction algorithm used by courts across the United States, was shown by ProPublica to assign higher risk scores to Black defendants than white defendants with similar criminal histories.
Responsible analytics requires that practitioners actively audit their models for bias, question the assumptions embedded in their training data, and design processes that include diverse human oversight at critical decision points.
9.21.8.2 Data Privacy
The collection, storage, and use of personal data is governed by a growing body of regulation: the European Union’s GDPR (General Data Protection Regulation), California’s CCPA (California Consumer Privacy Act), HIPAA for health information, and dozens of national and sector-specific frameworks. Beyond legal compliance, ethical analytics requires genuine respect for individuals’ right to privacy and informed consent about how their data is used.
9.31.8.3 Transparency and Explainability
Complex machine learning models — particularly deep neural networks — are often described as “black boxes” because their internal logic is opaque to human inspection. When these models are used to make consequential decisions (loan approvals, medical diagnoses, parole recommendations), the inability to explain why the model produced a particular output is not just a technical inconvenience — it is a fundamental fairness and accountability issue. The field of Explainable AI (XAI) is developing tools and methods to make model reasoning more transparent.
101.9 The AI-Era Analyst: New Skills, New Responsibilities
We are at an inflection point in the history of analytics. Generative AI is not just a new tool — it is changing the nature of analytical work itself. To understand why, consider how a typical analytics project was completed five years ago versus today.
Pre-GenAI workflow: An analyst spends several hours writing SQL queries to extract data, then more hours cleaning and reshaping it in Python, then writes visualization code, then interprets the statistical output, then writes a slide deck summarizing the findings.
GenAI-augmented workflow: The analyst describes the business problem to an AI assistant, which helps draft the SQL query. The assistant suggests data cleaning steps, flags potential data quality issues, generates visualization code, and produces a first-draft narrative interpretation of the results. The analyst’s role shifts toward directing, evaluating, and contextualizing — rather than executing every step manually.
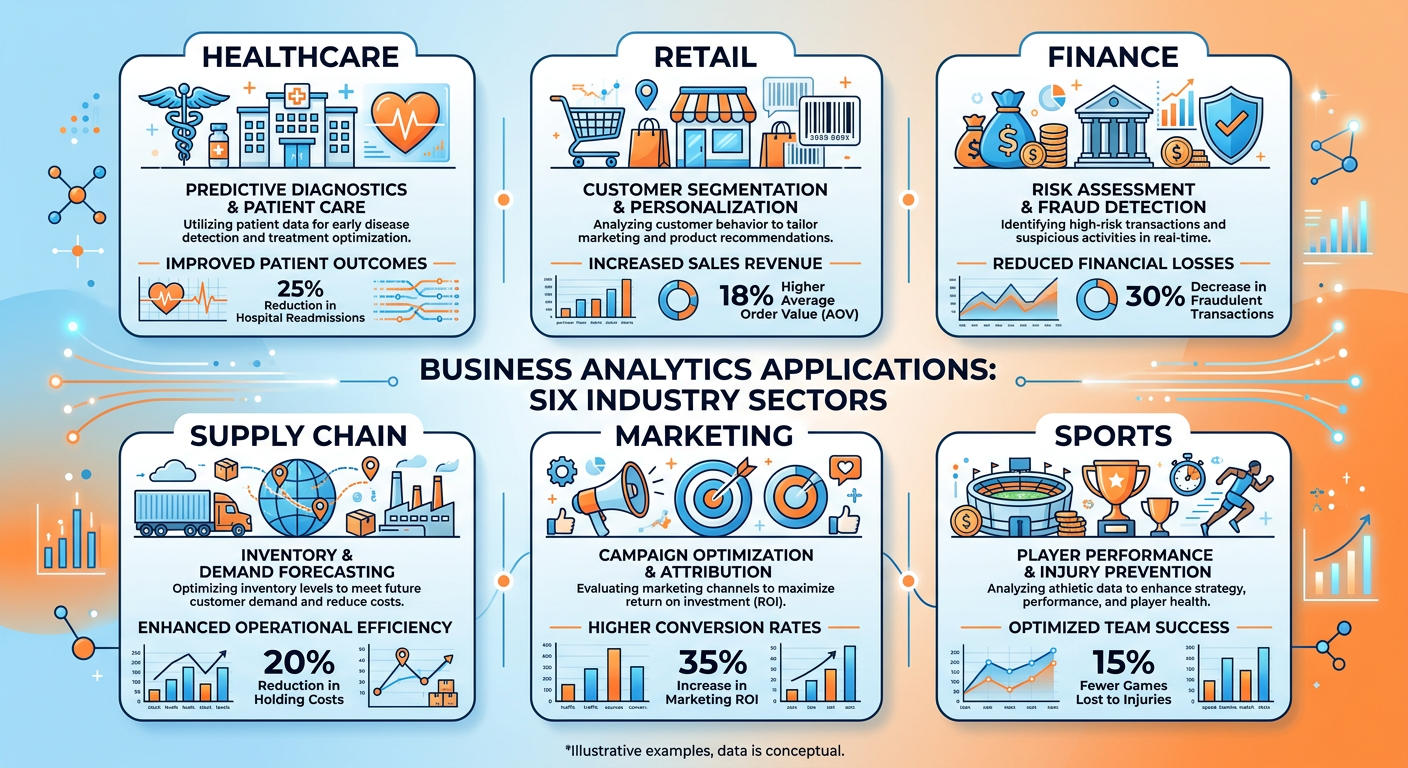
Figure 9:Traditional vs. AI-Augmented Analytics Workflow: Shifting the Analyst’s Role.
This shift places a premium on several meta-skills: the ability to formulate precise, well-scoped analytical questions (prompt engineering is, at its core, applied problem decomposition); the ability to critically evaluate AI-generated outputs for errors, biases, and logical flaws; the ability to communicate analytical findings persuasively to non-technical audiences; and a deep enough understanding of underlying methods to know when an AI’s suggestion is incorrect or misleading.
The AI-era analyst is not less skilled than the pre-AI analyst — they are differently skilled, and in many respects more strategically focused. This course is designed to develop exactly those capabilities.
111.10 Setting the Stage: What This Course Covers
Now that we have established what business analytics and data science are, why they matter, and how the field is evolving, let us preview the journey ahead in ISM 6405.
This course is structured around a progression from foundational concepts to advanced applied methods, always anchored in real business problems. Following this introductory chapter, we will cover statistical foundations for analytics, data wrangling and preparation, exploratory data analysis, predictive modeling with regression and classification, time series forecasting, clustering and segmentation, natural language processing, AI integration, and analytics communication and storytelling.
Each chapter will combine conceptual grounding with hands-on coding practice in Python, using Google Colab and, increasingly, the Gemini API to demonstrate how AI tools can accelerate and augment analytical workflows. You will complete projects that mirror the kinds of problems you will encounter in real organizations — not toy examples designed to produce clean results, but messy, ambiguous, real-world datasets that require judgment as well as technique.
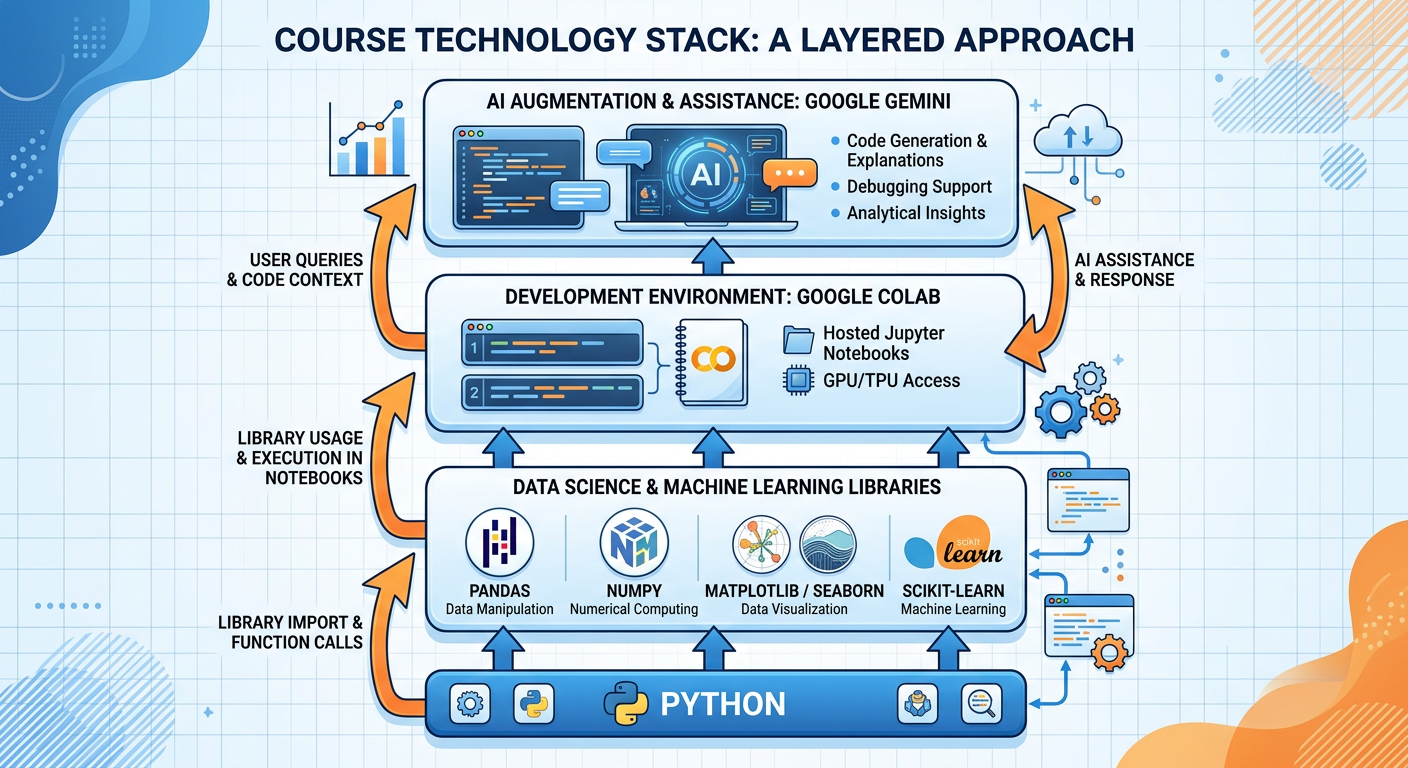
Figure 10:Course Roadmap: ISM 6405 Advanced Business Analytics Journey.
121.11 Discussion Question: The Netflix Case Study
Discussion Question:
Netflix’s use of data to make the “House of Cards” commissioning decision is celebrated as a triumph of data-driven decision-making. However, some media industry analysts and creative professionals have raised important counterarguments: that data-driven content development may suppress creative risk-taking, homogenize content toward existing audience preferences rather than discovering genuinely new tastes, and reduce the role of human creative judgment in ways that could impoverish culture over the long term.
Consider both sides of this debate carefully. Drawing on the concepts introduced in this chapter — the levels of analytics, the role of prescriptive vs. descriptive methods, the ethics of algorithmic decision-making, and the relationship between data and human judgment — write a structured response (400–600 words) that addresses the following questions:
What type(s) of analytics were most central to Netflix’s “House of Cards” decision, and what does this tell us about the strengths and limitations of each type?
Do you believe Netflix’s approach represents optimal decision-making, or does it carry risks that a purely data-centric view might miss? Justify your position with specific reasoning.
How should organizations like Netflix balance algorithmic insight with human creative and ethical judgment? Propose a practical framework for this balance that a Chief Data Officer at a media company could actually implement.
If you were an analytics translator on Netflix’s content strategy team in 2012, what additional data sources or analyses would you have wanted to see before recommending the “House of Cards” investment? What are the limits of what data can tell you in this situation?
12.1📝 Discussion Guidelines
Primary Response: Your initial post must address all parts of the prompt with depth and critical thinking. It must include at least one citation (scholarly or credible industry source) to support your argument.
Peer Responses: You must respond thoughtfully to at least two of your peers. Your responses must go beyond simple agreement (e.g., “I agree with your point”) and add substantial value to the conversation by offering an alternative perspective, sharing related research, or asking a challenging follow-up question.
131.12 Chapter Quiz
Answer all ten questions. Questions are drawn from the core concepts covered in this chapter. For multiple-choice questions, select the single best answer.
Question 1 Which level of business analytics is primarily concerned with understanding why a particular business outcome occurred, using techniques such as drill-down analysis, correlation studies, and root cause investigation?
A) Descriptive Analytics
B) Diagnostic Analytics
C) Predictive Analytics
D) Prescriptive Analytics
Question 2 Drew Conway’s Data Science Venn Diagram identifies three core competency areas that define data science. Which of the following correctly names all three?
A) Programming Skills, Business Acumen, and Database Management
B) Hacking Skills, Math and Statistics, and Substantive Expertise
C) Machine Learning, Data Engineering, and Visualization
D) Python Proficiency, SQL Knowledge, and Communication Skills
Question 3 The CRISP-DM framework is a standard process model for data science projects. Which of the following correctly describes the third phase of CRISP-DM?
A) Modeling — selecting and applying machine learning algorithms to the prepared dataset
B) Business Understanding — defining project objectives from a business perspective
C) Data Preparation — cleaning, transforming, and engineering features from raw data
D) Evaluation — assessing model performance against the original business objectives
Question 4 An airline uses a system that continuously adjusts ticket prices across thousands of fare classes in real time, accounting for demand forecasts, competitor pricing, and remaining seat inventory, with the goal of maximizing total revenue per flight. Which level of analytics best describes this system?
A) Descriptive Analytics
B) Diagnostic Analytics
C) Predictive Analytics
D) Prescriptive Analytics
Question 5 According to the McKinsey Global Institute research referenced in this chapter, which of the following most accurately describes a data-driven organization’s comparative advantage?
A) Data-driven organizations spend 40% less on IT infrastructure than their competitors.
B) Data-driven organizations are 23 times more likely to acquire customers and 19 times more likely to be profitable.
C) Data-driven organizations have 50% lower employee turnover than organizations that rely on intuition.
D) Data-driven organizations complete projects 30% faster due to automated reporting systems.
Question 6
**A ** company builds a machine learning model to predict employee attrition. After deployment, they discover that the model consistently assigns lower retention probability scores to employees from a specific demographic group, even when controlling for performance metrics. This is an example of which challenge in responsible analytics?
A) Model Overfitting
B) Data Pipeline Failure
C) Algorithmic Bias
D) Feature Engineering Error
Question 7 Which of the following best describes the role of an Analytics Translator in a modern data organization?
A) A software engineer who converts Python models into production-ready APIs
B) A professional who works at the interface between technical teams and business stakeholders, ensuring analytical work is correctly scoped and acted upon
C) A data engineer who transforms raw data from source systems into analytics-ready formats
D) A visualization specialist who converts statistical outputs into executive presentations
Question 8 The “Four V’s of Big Data” describe the core characteristics that make managing modern data challenging. Which of the following is NOT traditionally listed among the original Four V’s?
A) Volume
B) Velocity
C) Variety
D) Visibility
Question 9 In the context of the AI-era analyst described in Section 1.9, which of the following represents the most significant shift in the analyst’s role brought about by generative AI tools like Gemini?
A) Analysts no longer need to understand statistics because AI generates all models automatically.
B) The analyst’s role shifts from manually executing every step of the analytical workflow toward directing, evaluating, and contextualizing AI-generated outputs.
C) Generative AI has made SQL and Python skills obsolete for business analysts.
D) Analysts now primarily focus on data storage architecture rather than insight generation.
Question 10 Netflix’s decision to commission “House of Cards” in 2013 is described as a data-driven decision. Which combination of data patterns most directly informed this decision, according to the case study presented in this chapter?
A) High engagement with romantic comedies, strong mobile streaming usage, and positive social media sentiment
B) Overlap in the subscriber segment that loved the original British “House of Cards,” films directed by David Fincher, and films starring Kevin Spacey
C) A/B testing results showing that political drama thumbnails generated the highest click-through rates
D) Subscription churn analysis indicating that subscribers without access to original content canceled at higher rates
141.13 Hands-On Activity: Your First AI-Augmented Business Analytics Session
14.1Overview
Title: Introduction to Business Analytics with Google Colab and Gemini
Duration: 90–120 minutes
Difficulty: Beginner-friendly (no prior Python experience required)
Tools Required: Google Account, Google Colab (free), Gemini API Key (free tier available via Google AI Studio)
Learning Objectives: By completing this activity, you will be able to:
Navigate the Google Colab environment and execute Python code in a notebook.
Connect to the Gemini API and issue analytical prompts programmatically.
Load and perform basic exploratory analysis on a real-world business dataset.
Use Gemini as an analytical assistant to interpret results and suggest next steps.
Articulate the practical difference between descriptive, diagnostic, and predictive analytics through hands-on experience.
Step 1: Access Google Colab
Open your browser and navigate to colabISM6405_Chapter1_Activity.ipynb by clicking on the title at the top.
Step 2: Obtain Your Gemini API Key
Navigate to aistudio.google.com and sign in with the same Google account. Click “Get API Key” in the left sidebar, then “Create API Key”. Copy the key and store it somewhere safe — you will use it throughout this course.
Step 3: Install Required Libraries
In your Colab notebook, create a new code cell and run the following:
# Install required libraries
!pip install google-generativeai pandas matplotlib seaborn -q
The -q flag suppresses verbose installation output. This should complete in under 60 seconds in Colab’s cloud environment.
14.2Part 1: Setting Up Your Gemini-Powered Analytics Environment
Create a new code cell and enter the following code. This establishes your connection to the Gemini API and configures it for use throughout the activity.
# ============================================================
# ISM 6405: Advanced Business Analytics
# Chapter 1 Hands-On Activity
# AI-Augmented Business Analytics with Gemini
# Author: Dr. Ernesto Lee
# ============================================================

import google.generativeai as genai
import pandas as pd
import matplotlib.pyplot as plt
import matplotlib.ticker as mticker
import seaborn as sns
import warnings

warnings.filterwarnings('ignore')

# Configure plot aesthetics consistent with professional analytics output
plt.style.use('seaborn-v0_8-whitegrid')
BLUE = '#1A5276'
ORANGE = '#E67E22'
sns.set_palette([BLUE, ORANGE, '#2ECC71', '#9B59B6', '#E74C3C'])

# ---------------------------------------------------------------
# IMPORTANT: Replace the string below with your actual API key
# Never share your API key publicly or commit it to GitHub
# ---------------------------------------------------------------
GEMINI_API_KEY = "YOUR_API_KEY_HERE"  # <-- Replace this

genai.configure(api_key=GEMINI_API_KEY)

# Initialize the Gemini model
# gemini-1.5-flash is fast and cost-effective for analytical tasks
model = genai.GenerativeModel('gemini-1.5-flash')

# Test the connection with a simple business analytics prompt
test_prompt = """
You are an expert business analytics professor teaching graduate students
at Florida Atlantic University. In exactly two sentences, explain why
data-driven decision-making is critical for modern businesses.
"""

response = model.generate_content(test_prompt)
print("✅ Gemini API Connection Successful!\n")
print("Gemini says:")
print("-" * 60)
print(response.text)
print("-" * 60)
Expected Output: After replacing YOUR_API_KEY_HERE with your actual key and running the cell, you should see a confirmation message and a concise, well-written response from Gemini about data-driven decision-making. If you receive an authentication error, double-check that you copied the full API key correctly.
14.3Part 2: Loading and Exploring a Real Business Dataset
In this section, we will work with a real-world retail sales dataset. We use a publicly available version of the UCI Online Retail dataset, which contains transactional data from a UK-based online retailer. This dataset is a classic in business analytics education because it is messy, rich, and immediately interpretable.
# ============================================================
# Part 2: Load and Explore the Online Retail Dataset
# ============================================================

# Load the dataset directly from a public URL
# This is the UCI Online Retail dataset (modified for teaching)
url = "https://archive.ics.uci.edu/ml/machine-learning-databases/00352/Online%20Retail.xlsx"

print("📊 Loading Online Retail Dataset...")
print("(This may take 20-30 seconds on first load — the file is ~23MB)\n")

df = pd.read_excel(url)

print(f"✅ Dataset loaded successfully!")
print(f"   Shape: {df.shape[0]:,} rows × {df.shape[1]} columns\n")

# Display the first few rows
print("First 5 rows of the dataset:")
print(df.head())
Once the data loads, run the next cell to perform your first exploratory analysis:
# ============================================================
# Basic Descriptive Analytics: Understanding What We Have
# ============================================================

print("=" * 60)
print("DATASET OVERVIEW")
print("=" * 60)

print(f"\n📋 Column Names and Data Types:")
print(df.dtypes)

print(f"\n📉 Missing Values by Column:")
missing = df.isnull().sum()
missing_pct = (missing / len(df) * 100).round(2)
missing_summary = pd.DataFrame({
    'Missing Count': missing,
    'Missing %': missing_pct
})
print(missing_summary[missing_summary['Missing Count'] > 0])

print(f"\n📅 Date Range:")
print(f"   Earliest transaction: {df['InvoiceDate'].min()}")
print(f"   Latest transaction:   {df['InvoiceDate'].max()}")

print(f"\n🌍 Number of Unique Countries: {df['Country'].nunique()}")
print(f"🛍️  Number of Unique Products:  {df['StockCode'].nunique():,}")
print(f"👥 Number of Unique Customers: {df['CustomerID'].nunique():,}")
print(f"🧾 Number of Unique Invoices: {df['InvoiceNo'].nunique():,}")14.4Part 3: Descriptive Analytics — What Happened?
# ============================================================
# Part 3: Descriptive Analytics
# ============================================================

# --- Step 1: Clean the data for analysis ---
# Remove cancelled orders (InvoiceNo starting with 'C')
# Remove rows with missing CustomerID
# Remove rows with non-positive Quantity or UnitPrice

df_clean = df.copy()
df_clean = df_clean[~df_clean['InvoiceNo'].astype(str).str.startswith('C')]
df_clean = df_clean.dropna(subset=['CustomerID'])
df_clean = df_clean[df_clean['Quantity'] > 0]
df_clean = df_clean[df_clean['UnitPrice'] > 0]

# Create a Revenue column
df_clean['Revenue'] = df_clean['Quantity'] * df_clean['UnitPrice']

# Extract time features
df_clean['InvoiceDate'] = pd.to_datetime(df_clean['InvoiceDate'])
df_clean['Month'] = df_clean['InvoiceDate'].dt.to_period('M')
df_clean['DayOfWeek'] = df_clean['InvoiceDate'].dt.day_name()

print(f"✅ Data cleaned. Working dataset: {df_clean.shape[0]:,} rows\n")

# --- Step 2: Monthly Revenue Trend ---
monthly_revenue = df_clean.groupby('Month')['Revenue'].sum().reset_index()
monthly_revenue['Month_str'] = monthly_revenue['Month'].astype(str)

fig, axes = plt.subplots(1, 2, figsize=(16, 6))

# Plot 1: Monthly Revenue Trend
axes[0].bar(
    monthly_revenue['Month_str'],
    monthly_revenue['Revenue'],
    color=BLUE,
    alpha=0.85,
    edgecolor='white'
)
axes[0].set_title('Monthly Revenue Trend\n(Descriptive Analytics)',
                   fontsize=14, fontweight='bold', color=BLUE, pad=15)
axes[0].set_xlabel('Month', fontsize=11)
axes[0].set_ylabel('Total Revenue (£)', fontsize=11)
axes[0].tick_params(axis='x', rotation=45)
axes[0].yaxis.set_major_formatter(
    mticker.FuncFormatter(lambda x, _: f'£{x:,.0f}')
)

# Add a trend indicator to the highest month
max_month = monthly_revenue.loc[monthly_revenue['Revenue'].idxmax()]
axes[0].annotate(
    f'Peak: £{max_month["Revenue"]:,.0f}',
    xy=(max_month['Month_str'], max_month['Revenue']),
    xytext=(0, 15),
    textcoords='offset points',
    ha='center',
    fontsize=9,
    color=ORANGE,
    fontweight='bold',
    arrowprops=dict(arrowstyle='->', color=ORANGE)
)

# Plot 2: Top 10 Countries by Revenue (excluding UK as it dominates)
country_revenue = (
    df_clean[df_clean['Country'] != 'United Kingdom']
    .groupby('Country')['Revenue']
    .sum()
    .sort_values(ascending=False)
    .head(10)
    .reset_index()
)

axes[1].barh(
    country_revenue['Country'][::-1],
    country_revenue['Revenue'][::-1],
    color=ORANGE,
    alpha=0.85,
    edgecolor='white'
)
axes[1].set_title('Top 10 Countries by Revenue\n(Excluding UK)',
                   fontsize=14, fontweight='bold', color=BLUE, pad=15)
axes[1].set_xlabel('Total Revenue (£)', fontsize=11)
axes[1].xaxis.set_major_formatter(
    mticker.FuncFormatter(lambda x, _: f'£{x:,.0f}')
)

plt.suptitle(
    'Online Retail: Descriptive Analytics Dashboard',
    fontsize=16,
    fontweight='bold',
    y=1.02,
    color=BLUE
)
plt.tight_layout()
plt.savefig('ch01_descriptive_analytics.png', dpi=150, bbox_inches='tight')
plt.show()
print("\n📊 Descriptive analytics visualizations complete.")14.5Part 4: Asking Gemini to Interpret Your Results
This is where the AI-augmented workflow becomes tangible. Instead of just reading charts, we will ask Gemini to interpret our findings and suggest diagnostic next steps — just as a senior analytics colleague might do.
# ============================================================
# Part 4: Gemini as Your Analytical Collaborator
# ============================================================

# Prepare a data summary to share with Gemini
monthly_summary = monthly_revenue[['Month_str', 'Revenue']].copy()
monthly_summary['Revenue'] = monthly_summary['Revenue'].round(2)
monthly_summary_str = monthly_summary.to_string(index=False)

top_countries_str = country_revenue[['Country', 'Revenue']].to_string(index=False)

# Construct a detailed analytical prompt
analytical_prompt = f"""
You are a Senior Business Analytics Consultant reviewing initial findings
from an online retail company's sales data. Your client is a UK-based
e-commerce retailer selling home goods and gifts.

Here is the descriptive analytics summary you have been presented with:

MONTHLY REVENUE DATA (Nov 2010 – Dec 2011):
{monthly_summary_str}

TOP 10 INTERNATIONAL MARKETS (by revenue, excluding UK):
{top_countries_str}

Based on this descriptive analytics output, please provide:

1. DESCRIPTIVE SUMMARY (2-3 sentences): What are the key patterns visible
   in this data? What story does it tell?

2. DIAGNOSTIC HYPOTHESES (3 bullet points): What are the most likely
   explanations for the revenue patterns you observe? What business factors
   might explain the seasonality and geographic distribution?

3. PREDICTIVE QUESTIONS (2 bullet points): What would you want to predict
   next, given these patterns? Frame each as a specific business question.

4. RECOMMENDED NEXT ANALYSIS (1 paragraph): What specific additional
   analysis should the team conduct to move from descriptive to diagnostic
   analytics? Be specific about what data and methods you would use.

5. BUSINESS RISK FLAGS (2 bullet points): Are there any concerning patterns
   in this data that a business leader should be immediately aware of?

Format your response clearly with the numbered sections above.
Keep the total response under 450 words — executive-friendly and actionable.
"""

print("🤖 Asking Gemini to interpret our descriptive analytics results...\n")
print("=" * 60)

gemini_interpretation = model.generate_content(analytical_prompt)

print("GEMINI'S ANALYTICAL INTERPRETATION:")
print("=" * 60)
print(gemini_interpretation.text)
print("=" * 60)14.6Part 5: Diagnostic Analytics — Drilling Deeper
# ============================================================
# Part 5: Diagnostic Analytics — Why Did It Happen?
# ============================================================

# Investigate the revenue spike: Is it driven by more customers,
# more transactions per customer, or higher value per transaction?

monthly_diagnostics = df_clean.groupby('Month').agg(
    Total_Revenue=('Revenue', 'sum'),
    Unique_Customers=('CustomerID', 'nunique'),
    Total_Transactions=('InvoiceNo', 'nunique'),
    Avg_Transaction_Value=('Revenue', 'mean'),
    Total_Items_Sold=('Quantity', 'sum')
).reset_index()

monthly_diagnostics['Month_str'] = monthly_diagnostics['Month'].astype(str)
monthly_diagnostics['Revenue_per_Customer'] = (
    monthly_diagnostics['Total_Revenue'] /
    monthly_diagnostics['Unique_Customers']
)

# Visualize the diagnostic decomposition
fig, axes = plt.subplots(2, 2, figsize=(16, 12))

metrics = [
    ('Unique_Customers', 'Number of Active Customers', BLUE, ''),
    ('Total_Transactions', 'Number of Transactions', ORANGE, ''),
    ('Revenue_per_Customer', 'Revenue per Customer (£)', BLUE, '£'),
    ('Avg_Transaction_Value', 'Avg Transaction Value (£)', ORANGE, '£'),
]

for ax, (col, title, color, prefix) in zip(axes.flat, metrics):
    ax.plot(
        monthly_diagnostics['Month_str'],
        monthly_diagnostics[col],
        color=color,
        linewidth=2.5,
        marker='o',
        markersize=6,
        markerfacecolor='white',
        markeredgewidth=2
    )
    ax.fill_between(
        monthly_diagnostics['Month_str'],
        monthly_diagnostics[col],
        alpha=0.12,
        color=color
    )
    ax.set_title(title, fontsize=12, fontweight='bold', color=BLUE, pad=10)
    ax.tick_params(axis='x', rotation=45, labelsize=8)
    if prefix:
        ax.yaxis.set_major_formatter(
            mticker.FuncFormatter(lambda x, _, p=prefix: f'{p}{x:,.0f}')
        )

plt.suptitle(
    'Diagnostic Analytics: Decomposing the Revenue Pattern\n'
    'What Factors Are Driving Revenue Changes?',
    fontsize=15,
    fontweight='bold',
    color=BLUE,
    y=1.01
)
plt.tight_layout()
plt.savefig('ch01_diagnostic_analytics.png', dpi=150, bbox_inches='tight')
plt.show()

print("\n🔍 Diagnostic analytics decomposition complete.")
print("   Review the four panels to understand the drivers of revenue change.")
# ============================================================
# Ask Gemini for a Diagnostic Interpretation
# ============================================================
# Prepare the diagnostic data for Gemini
diag_summary = monthly_diagnostics[
['Month_str', 'Unique_Customers', 'Total_Transactions',
'Revenue_per_Customer', 'Avg_Transaction_Value']
].round(2).to_string(index=False)
diagnostic_prompt = f"""
You are a Senior Business Analytics Consultant. Your team has conducted a
diagnostic decomposition of monthly revenue for a UK-based online gift retailer.
The goal is to understand *why* revenue increases toward year-end.
Here is the decomposition data:
{diag_summary}
Please provide a DIAGNOSTIC ANALYSIS (maximum 300 words) that:
1. Identifies which factor (customer growth, transaction frequency, or
spend per customer/transaction) most strongly drives the revenue pattern.
2. Proposes the most plausible business explanation for this pattern,
considering this is a gift and home goods retailer.
3. Identifies one potential concern hidden within the data that a
business leader might overlook when celebrating the revenue peak.
4. Recommends one specific, actionable intervention the business should
consider based on this diagnostic finding.
Be direct, specific, and write for a VP of Marketing audience.
"""
print("🤖 Asking Gemini for diagnostic interpretation...\n")
print("=" * 60)
diag_response = model.generate_content(diagnostic_prompt)
print("GEMINI'S DIAGNOSTIC ANALYSIS:")
print("=" * 60)
print(diag_response.text)
print("=" * 60)14.7Part 6: Reflection and Synthesis
The final part of this activity brings you back from the code to the concepts — asking you to synthesize what you have just experienced.
# ============================================================
# Part 6: Automated Reflection Report Generation
# ============================================================

reflection_prompt = f"""
- **A ** graduate student in ISM 6405 Advanced Business Analytics at Florida
Atlantic University has just completed their first hands-on analytics
activity. They analyzed an online retail dataset and used AI assistance
to interpret descriptive and diagnostic analytics results.

Generate a structured LEARNING REFLECTION PROMPT (not answers — just
questions for the student to reflect on) that asks them to consider:

1. The experience of moving from descriptive to diagnostic analytics
2. The value and limitations of using Gemini as an analytical collaborator
3. One business decision they could now support with this analysis
4. One ethical consideration raised by the data or the methods used
5. What they still need to learn to conduct predictive analytics on this data

Format as 5 numbered reflection questions, each 1-2 sentences.
Make the questions genuinely thought-provoking for a graduate business student.
"""

print("🤖 Generating your personalized reflection prompts...\n")
print("=" * 60)
reflection = model.generate_content(reflection_prompt)
print("YOUR CHAPTER 1 REFLECTION QUESTIONS:")
print("=" * 60)
print(reflection.text)
print("=" * 60)
print("\n✅ Chapter 1 Hands-On Activity Complete!")
print("   Save your notebook to Google Drive and submit via Canvas.")
print(" Include screenshots of your two generated charts in your submission.")14.8Submission Instructions
Submit the following to the ISM 6405 Canvas course page under Chapter 1 Activity:
Your completed Colab notebook — File → Download → Download .ipynb — uploaded to Canvas.
Two chart screenshots:
ch01_descriptive_analytics.pngandch01_diagnostic_analytics.png(these are automatically saved by your notebook).Written reflection (200–300 words) responding to the five reflection questions generated by Gemini in Part 6. This should be submitted as a separate text entry or Word document.
| Component | Points | Criteria |
|---|---|---|
| Colab Notebook | 40 | All cells execute without errors; code is properly annotated |
| Descriptive Analytics Chart | 15 | Chart renders correctly with proper labels and formatting |
| Diagnostic Analytics Chart | 15 | All four panels render correctly |
| Gemini Integration | 10 | API calls execute and produce meaningful responses |
| Written Reflection | 20 | Demonstrates genuine engagement with course concepts; connects hands-on experience to chapter theory |
| Total | 100 |
“ModuleNotFoundError: No module named ‘google.generativeai’”
Re-run the installation cell (!pip install google-generativeai ...) and then restart the runtime (Runtime → Restart Runtime) before re-running subsequent cells.
“API Key not valid” error Ensure you have copied the complete API key from Google AI Studio without any extra spaces. Verify that the Generative Language API is enabled in your Google Cloud project.
Excel file loading fails or times out If the UCI URL is unavailable, use this alternative: replace the URL with a Google Drive hosted copy provided on Canvas under Course Resources → Datasets → Chapter1.
Charts do not display
Ensure plt.show() is called after plt.savefig(). In Colab, inline display is enabled by default, but if disabled, add %matplotlib inline to your setup cell.
15Chapter Summary
This chapter has established the foundational framework for everything that follows in ISM 6405. We began by situating ourselves in the data revolution — appreciating the extraordinary scale and speed of data generation in the modern economy, and the competitive imperative this creates for analytically capable organizations. We defined business analytics precisely, mapping its four progressive levels — descriptive, diagnostic, predictive, and prescriptive — and illustrating each with real-world business applications that demonstrate both their power and their limitations.
We then defined data science as a complementary but distinct discipline rooted in the intersection of statistical expertise, computational skill, and domain knowledge. We compared the two fields honestly: they share tools, methods, and a common commitment to evidence-based reasoning, but they differ in focus, deliverables, and career pathways. Understanding both fields — and the ecosystem of roles that make up modern analytics organizations — positions you to collaborate effectively and to build a career path intentionally.
We surveyed the technology landscape, from the humble spreadsheet to large language models, emphasizing that tools matter but judgment matters more. We discussed the profound ethical responsibilities that come with analytical power: the obligation to audit for bias, to respect privacy, to pursue transparency, and to remember that behind every data point is a human being whose life may be affected by the decisions our models inform.
Finally, we characterized the AI-era analyst — a professional who leverages generative AI tools like Gemini as a force multiplier, while bringing irreplaceable human judgment, contextual understanding, and ethical awareness to analytical work. In the hands-on activity, you experienced this collaboration firsthand, exploring a real retail dataset and co-interpreting findings with Gemini across the descriptive and diagnostic analytics levels.
As you move forward in this course, carry these foundational principles with you: analytics serves business, not the other way around; data is powerful but never neutral; and the most valuable analytical skill is asking better questions.
16References and Further Reading
The following sources informed the content of this chapter and are recommended for students who wish to explore these topics in greater depth. Where possible, open-access versions are available through the FAU library system.
Foundational Texts
Davenport, T. H., & Harris, J. G. (2007). Competing on analytics: The new science of winning. Harvard Business School Press. — The book that popularized the term “competing on analytics” and remains essential reading for understanding how organizations build analytical capability as a strategic asset.
Provost, F., & Fawcett, T. (2013). Data science for business: What you need to know about data mining and data-analytic thinking. O’Reilly Media. — One of the best business-oriented introductions to data science methods, written for readers with business backgrounds who want to develop genuine analytical fluency.
Shmueli, G., Bruce, P. C., Gedeck, P., & Patel, N. R. (2023). Data mining for business analytics: Concepts, techniques, and applications in Python (5th ed.). Wiley. — A comprehensive and accessible textbook covering the full spectrum of predictive analytics methods with Python implementations.
Analytics Maturity and Organizational Capability
Gartner Research. (2023). Magic Quadrant for analytics and business intelligence platforms. Gartner, Inc. — Annual industry analysis providing detailed comparison of leading analytics platforms and emerging market trends.
McKinsey Global Institute. (2021). The data-driven enterprise of 2025. McKinsey & Company. — A forward-looking report examining how leading organizations are building data and analytics capabilities and what distinguishes high performers.
TDWI Research. (2022). TDWI analytics maturity model guide. TDWI (Transforming Data with Intelligence). — A detailed guide to the five-level analytics maturity framework, with practical assessment tools for organizations at each stage.
Data Science Methods and Process
Wirth, R., & Hipp, J. (2000). CRISP-DM: Towards a standard process model for data mining. Proceedings of the 4th International Conference on the Practical Applications of Knowledge Discovery and Data Mining, 1–12. — The original academic paper introducing the CRISP-DM framework, foundational reading for any data science practitioner.
Conway, D. (2010, September 30). The data science Venn diagram. Drew Conway’s Blog. [drewconway
Ethics and Responsible Analytics
O’Neil, C. (2016). Weapons of math destruction: How big data increases inequality and threatens democracy. Crown Publishers. — A landmark work examining the ways in which poorly designed or intentionally exploitative algorithms cause harm at scale. Essential reading for anyone entering the analytics profession.
Barocas, S., Hardt, M., & Narayanan, A. (2023). Fairness and machine learning: Limitations and opportunities. MIT Press. [fairmlbook.org] — A rigorous but accessible academic treatment of algorithmic fairness, available free online.
Eubanks, V. (2018). Automating inequality: How high-tech tools profile, police, and punish the poor. St. Martin’s Press. — A deeply researched examination of how automated decision systems affect vulnerable populations, essential context for ethical analytics practice.
AI and the Future of Analytics
Davenport, T. H., & Ronanki, R. (2018). Artificial intelligence for the real world. Harvard Business Review, 96(1), 108–116. — A practical framework for categorizing AI applications by their business impact and implementation complexity.
Google DeepMind. (2024). Gemini: A family of highly capable multimodal models. Google Research Technical Report. — The technical overview of Google’s Gemini model family, including capabilities, architecture, and benchmark performance.
Chui, M., Hazan, E., Roberts, R., Singla, A., Smaje, K., Sukharevsky, A., Yee, L., & Zemmel, R. (2023). The economic potential of generative AI: The next productivity frontier. McKinsey Global Institute. — McKinsey’s comprehensive analysis of how generative AI is expected to transform work across industries, including detailed estimates of productivity impact in analytics-intensive roles.
Industry Case Studies
Amatriain, X., & Basilico, J. (2012). Netflix recommendations: Beyond the 5 stars. Netflix Technology Blog. — The original Netflix technical blog post describing their recommendation system architecture, a foundational case study in large-scale collaborative filtering.
Anderson, C. (2006). The long tail: Why the future of business is selling less of more. Hyperion Books. — Explores how data-driven personalization and recommendation systems enable businesses to profitably serve niche customer preferences at scale, with Amazon and Netflix as central case studies.
Python and Technical Resources
McKinney, W. (2022). Python for data analysis: Data wrangling with pandas, NumPy, and Jupyter (3rd ed.). O’Reilly Media. — The definitive reference for the pandas library, written by its creator. An essential desk reference for data analysts working in Python.
VanderPlas, J. (2023). Python data science handbook: Essential tools for working with data (2nd ed.). O’Reilly Media. [jakevdp
Google AI. (2024). Gemini API documentation and quickstart guides. Google for Developers. [ai.google.dev] — The official documentation for the Gemini API, including Python SDK reference, prompt engineering guides, and usage examples. Students should bookmark this resource and refer to it throughout the course.
End of Chapter 1
ISM 6405 Advanced Business Analytics | Florida Atlantic University | Dr. Ernesto Lee