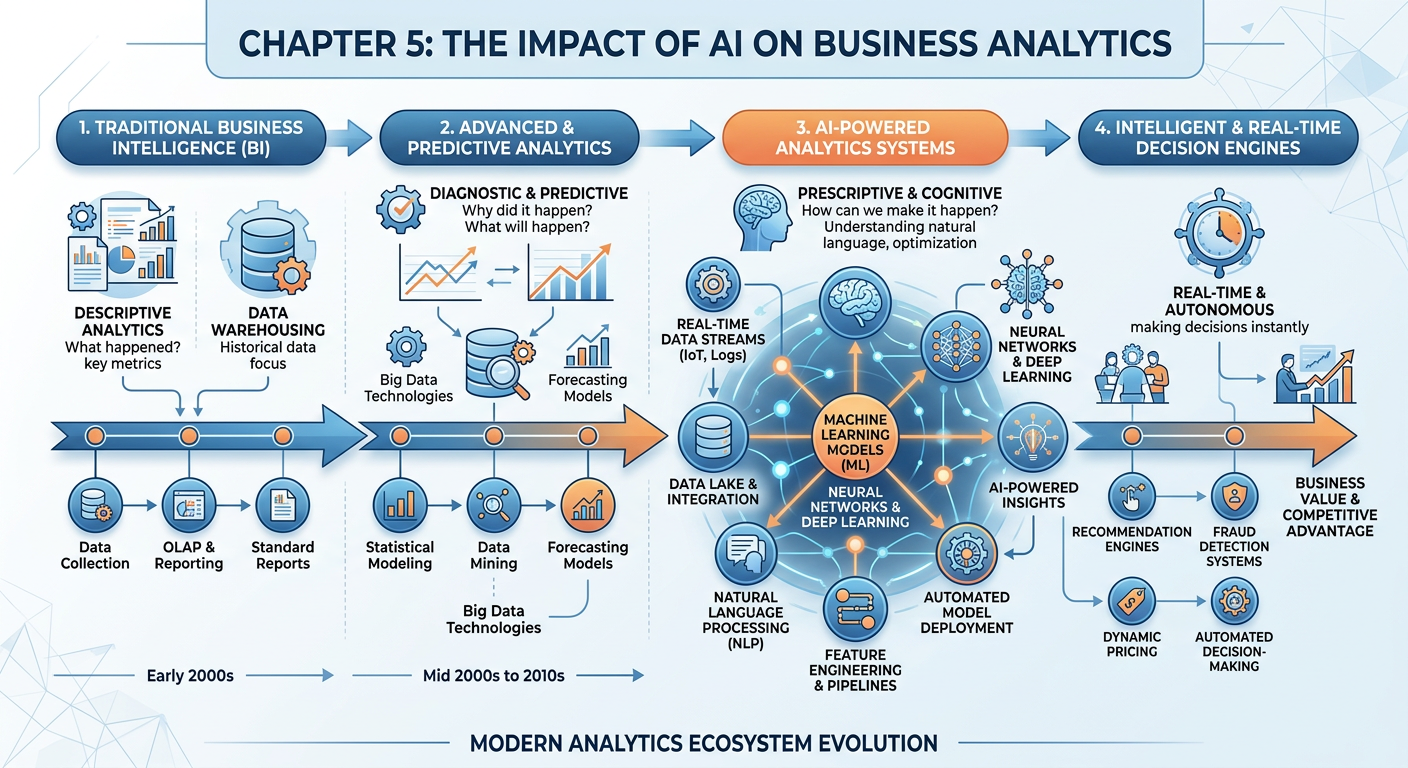
Figure 1:Explainer Infographic: Chapter 5: The Impact of AI on Business Analytics.
1Introduction: A Profession in Transformation
Not long ago, the business analytics workflow looked something like this: a data analyst would receive a request from a business stakeholder, spend days querying databases and cleaning spreadsheets, build a static dashboard in Tableau or Power BI, and present findings in a PowerPoint deck that was often outdated by the time it reached the executive team. The entire process was human-intensive, time-consuming, and inherently backward-looking. Analysts were, in essence, professional historians — excellent at describing what had already happened, but constrained in their ability to predict what would happen next or prescribe what to do about it.
Artificial intelligence has shattered that paradigm.
Welcome to Chapter 5 of ISM 6405: Advanced Business Analytics. In the chapters preceding this one, you developed a strong foundation in the core methods of business analytics: descriptive statistics, data visualization, predictive modeling, and prescriptive optimization. Now, we turn our attention to the seismic shift that AI has introduced into every layer of these workflows — not as a futuristic possibility, but as a present-day operational reality that is reshaping how organizations hire, structure, and deploy their analytics capabilities.
This chapter is organized around a central thesis: AI has not merely enhanced traditional analytics workflows — it has disrupted their fundamental logic. The disruption touches everything from data collection and preparation to model building, insight generation, stakeholder communication, and strategic decision-making. For the graduate student in business analytics, understanding this disruption is not optional. It is the professional imperative of our era.
By the end of this chapter, you will be able to:
Describe how AI has changed each stage of the traditional analytics workflow
Evaluate the opportunities and risks that AI introduces in business analytics contexts
Distinguish between augmented intelligence and automated intelligence in organizational settings
Apply generative AI tools, specifically Claude.ai, to real analytics tasks
Critically assess the ethical and organizational implications of AI-driven analytics
Let us begin.
25.1 The Traditional Analytics Workflow: A Brief Retrospective
Before we can appreciate the disruption AI has caused, we need to clearly understand what it disrupted. The traditional business analytics workflow, as codified by practitioners and scholars throughout the 2000s and 2010s, followed a recognizable sequence of stages. While different frameworks used different terminology, the essential structure was consistent across industries.
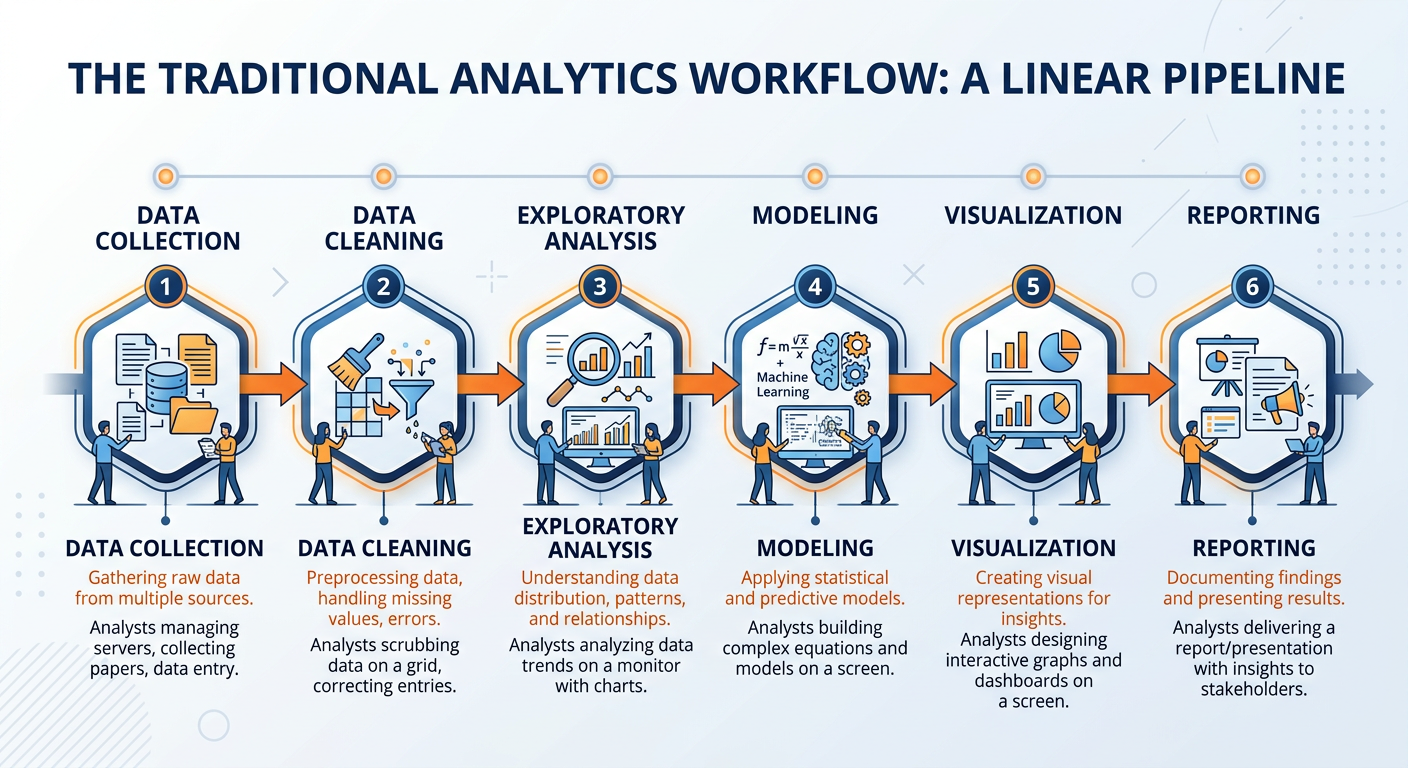
Figure 2:The Traditional Analytics Workflow: Six sequential stages from raw data to business insight, each dependent on significant human effort and domain expertise.
Stage 1: Data Collection and Integration. Analysts would identify relevant data sources — typically internal databases, CRM systems, ERP platforms, and occasionally external datasets — and use Extract, Transform, Load (ETL) processes to pull data into a centralized data warehouse. This stage was notoriously labor-intensive, often requiring coordination between IT teams, database administrators, and business units. At large enterprises, data governance debates alone could delay a project by weeks.
Stage 2: Data Cleaning and Preparation. Industry surveys consistently found that data professionals spent between 60 and 80 percent of their time on this stage. Handling missing values, correcting inconsistent formats, removing duplicates, standardizing units of measurement, and resolving conflicting records across systems — these were unglamorous but essential tasks that required both technical skill and business judgment.
Stage 3: Exploratory Data Analysis (EDA). Once data was prepared, analysts would explore it through summary statistics, distributions, correlations, and visualizations. The goal was to understand the structure of the data, identify anomalies, and generate hypotheses. Tools like R, Python, and SAS were commonly used for this stage, though many analysts still relied heavily on Excel.
Stage 4: Modeling and Analysis. Depending on the business question, analysts would apply statistical models, machine learning algorithms, or optimization techniques. Regression models, decision trees, clustering algorithms, and time series forecasting were workhorses of this stage. Building a reliable model required iterative experimentation, feature engineering, cross-validation, and performance tuning — all demanding significant expertise.
Stage 5: Visualization and Storytelling. Raw model outputs are rarely decision-ready. This stage involved translating analytical findings into charts, dashboards, and narratives that non-technical stakeholders could understand and act upon. Tools like Tableau, Power BI, and Matplotlib were used to create visual representations, while the art of “data storytelling” emerged as a recognized professional competency.
Stage 6: Reporting and Decision Support. Finally, findings were packaged into reports, presentations, or interactive dashboards, delivered to decision-makers, and used to inform business strategy. This stage often involved back-and-forth communication as stakeholders requested different cuts of the data or raised new questions, sending analysts back to earlier stages of the workflow.
The traditional workflow produced real value, and its practitioners developed genuine expertise. But it had structural limitations that became increasingly apparent as the pace of business accelerated: it was slow, expensive, backward-looking by default, and accessible only to organizations large enough to employ specialized analytical talent. These limitations set the stage for AI’s disruptive entrance.
35.2 The AI Disruption: What Changed and Why It Matters
The term “disruption” is overused in business literature, often applied to any incremental improvement dressed in new clothes. True disruption, as Clayton Christensen originally defined it, involves a technology or business model that initially serves niche needs but ultimately displaces established approaches by offering a fundamentally different value proposition — typically greater accessibility, speed, or cost-effectiveness.
By that rigorous standard, AI represents a genuine disruption of business analytics — and arguably one of the most significant in the field’s history.
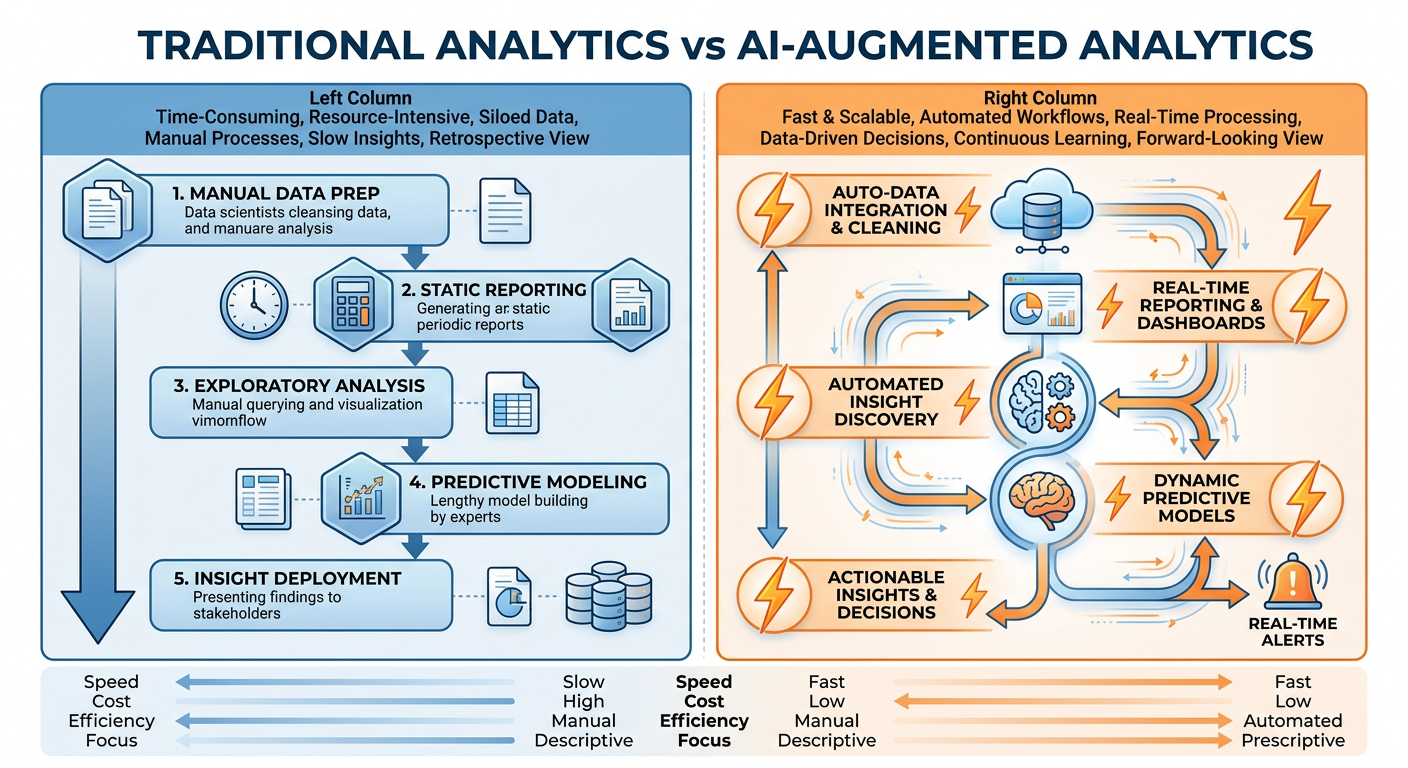
Figure 3:Traditional vs. AI-Augmented Analytics: The disruption is not merely one of speed but of fundamental workflow logic, enabling parallel processing, continuous learning, and democratized access to advanced analytical capabilities.
The disruption operates across three distinct dimensions:
Dimension 1: Speed and Scale. AI systems can process data at speeds and scales that are categorically beyond human capability. A large language model can analyze thousands of customer reviews in seconds. A machine learning pipeline can be retrained on updated data continuously and automatically. What once took an analytics team weeks can now be accomplished in hours or minutes. This is not an incremental improvement — it changes the economics of analytics entirely.
Dimension 2: Accessibility and Democratization. Perhaps the most profound disruption is the democratization of analytical capability. AI-powered tools — including no-code platforms, natural language query interfaces, and generative AI assistants — have dramatically lowered the technical barrier to entry for business analytics. A marketing manager with no programming background can now ask questions of their data in plain English and receive sophisticated analytical outputs. This democratization threatens the specialist monopoly that analytics professionals once held, while simultaneously creating new opportunities for those who can work effectively at the human-AI interface.
Dimension 3: The Shift from Descriptive to Predictive and Prescriptive. Traditional analytics was predominantly descriptive by default — not because analysts lacked ambition, but because the time and resource constraints of manual workflows rarely permitted deeper analysis. AI has shifted the default toward predictive and prescriptive analytics, making it economically feasible to not just ask “what happened?” but to continuously generate answers to “what will happen?” and “what should we do?”
45.3 Stage-by-Stage: How AI Has Transformed Each Phase of the Analytics Workflow
Let us now walk through each stage of the traditional workflow and examine specifically how AI has transformed it. This is where theory meets practice, and where the graduate student begins to see not just what has changed, but what those changes mean for professional practice.
4.15.3.1 Data Collection and Integration: From ETL to Intelligent Data Pipelines
The traditional ETL process was brittle by design. It required explicit, hand-coded transformations for every data source and every schema change. When a source system updated its format, someone had to fix the pipeline manually. This made data engineering a constant firefighting exercise at most organizations.
AI has introduced several transformative capabilities at this stage:
Automated Schema Matching. Machine learning models can now compare data schemas across disparate systems and automatically infer mapping relationships, dramatically reducing the manual effort required to integrate new data sources. Tools like Informatica AI, Talend, and AWS Glue incorporate these capabilities as standard features.
Natural Language Data Access. Generative AI models have enabled natural language interfaces to databases. Tools like Amazon Q, Microsoft Copilot for Power BI, and various Text-to-SQL solutions allow business users to request data in plain English, with the AI generating the appropriate SQL queries behind the scenes. This fundamentally changes who can access raw data.
Intelligent Data Quality Monitoring. AI-powered anomaly detection systems continuously monitor data streams for quality issues — unexpected value distributions, missing fields, format violations — and flag or automatically correct problems in real time, replacing what was once a periodic manual quality audit.
4.25.3.2 Data Cleaning and Preparation: The End of the 80% Problem?
The statistic that data professionals spend 60–80% of their time on data cleaning has become something of an industry lament — but AI is aggressively attacking this bottleneck.
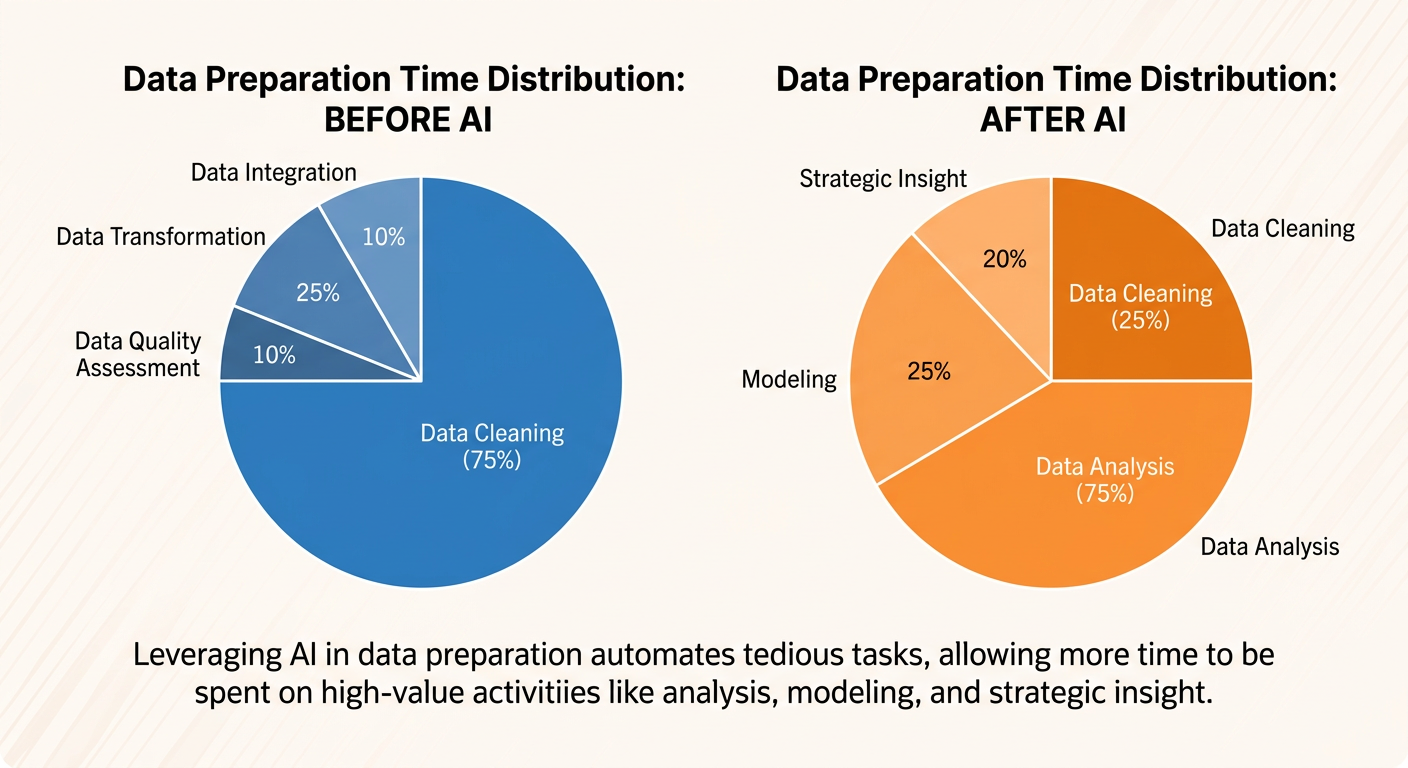
Figure 4:The Data Preparation Time Shift: AI-powered data cleaning tools are redistributing where analysts spend their time, moving the profession toward higher-value activities.
Automated Imputation. Rather than requiring an analyst to manually decide how to handle missing values, modern AutoML platforms use predictive models to intelligently impute missing data based on patterns in the surrounding dataset. This produces more statistically sound imputations than simple mean or mode substitution.
AI-Assisted Feature Engineering. Feature engineering — the art of transforming raw variables into more predictive representations — was historically one of the most skill-intensive parts of analytics work. Tools like FeatureTools and the feature engineering modules within platforms like H2O.ai and DataRobot can now automatically generate and evaluate hundreds of feature transformations, dramatically accelerating this process.
Natural Language Data Transformation. Generative AI tools, including Claude.ai, can interpret natural language descriptions of data transformation requirements and generate the corresponding Python or R code. An analyst can describe what they want — “standardize all currency fields to USD using the exchange rates from the date column” — and receive executable code almost instantly.
# Example: AI-generated data cleaning code from natural language prompt
# Prompt: "Clean the customer_revenue column by removing currency symbols,
# converting to float, and handling nulls with the column median"

import pandas as pd
import numpy as np

def clean_revenue_column(df, column='customer_revenue'):
    """
    AI-generated data cleaning function.
    Removes currency symbols, converts to float,
    and imputes nulls with column median.
    """
    # Remove currency symbols and whitespace
    df[column] = df[column].astype(str).str.replace(r'[$,\s]', '', regex=True)

    # Convert to numeric, coercing errors to NaN
    df[column] = pd.to_numeric(df[column], errors='coerce')

    # Impute nulls with median
    median_value = df[column].median()
    df[column] = df[column].fillna(median_value)

    return df

# Apply the function
df_clean = clean_revenue_column(df)
print(f"Cleaned {df['customer_revenue'].isna().sum()} null values")
print(f"Revenue column stats:\n{df_clean['customer_revenue'].describe()}")4.35.3.3 Exploratory Data Analysis: AI as a Collaborative Research Partner
Exploratory Data Analysis has perhaps seen the most visible transformation from generative AI. Historically, EDA required an analyst to iteratively generate visualizations and statistics, mentally synthesizing patterns across many individual outputs. AI has introduced the capacity for what we might call conversational EDA — a fluid, back-and-forth exploration of data guided by natural language questions.
Traditional EDA Approach:
Analyst manually writes code to generate summary statistics
Iterative visualization process — one chart at a time
Pattern recognition entirely dependent on analyst experience
Documentation of findings is a separate, time-consuming step
Average time for comprehensive EDA: 4–16 hours depending on dataset complexity
AI-Augmented EDA Approach:
Natural language queries generate instant statistical summaries
Automated visualization recommendations based on data types and distributions
AI identifies patterns, anomalies, and correlations simultaneously
Narrated outputs document findings in real time
Average time for comprehensive EDA: 30 minutes to 2 hours
Tools like Pandas AI, Julius AI, and Claude.ai’s data analysis capabilities allow analysts to upload datasets and ask questions like “What are the strongest predictors of customer churn in this dataset?” or “Are there any concerning multicollinearity issues among the independent variables?” and receive sophisticated, contextually aware responses.
This does not mean the analyst’s role disappears — quite the contrary. The analyst’s judgment is now exercised at a higher level: evaluating the quality of AI-generated insights, directing the analytical inquiry with sharper business questions, and translating findings into organizational action. The analyst becomes an analytical director rather than an analytical executor.
4.45.3.4 Modeling: AutoML, Foundation Models, and the New Model Landscape
The modeling stage has experienced perhaps the deepest structural transformation from AI, introducing two distinct but complementary revolutions: AutoML and Foundation Models.
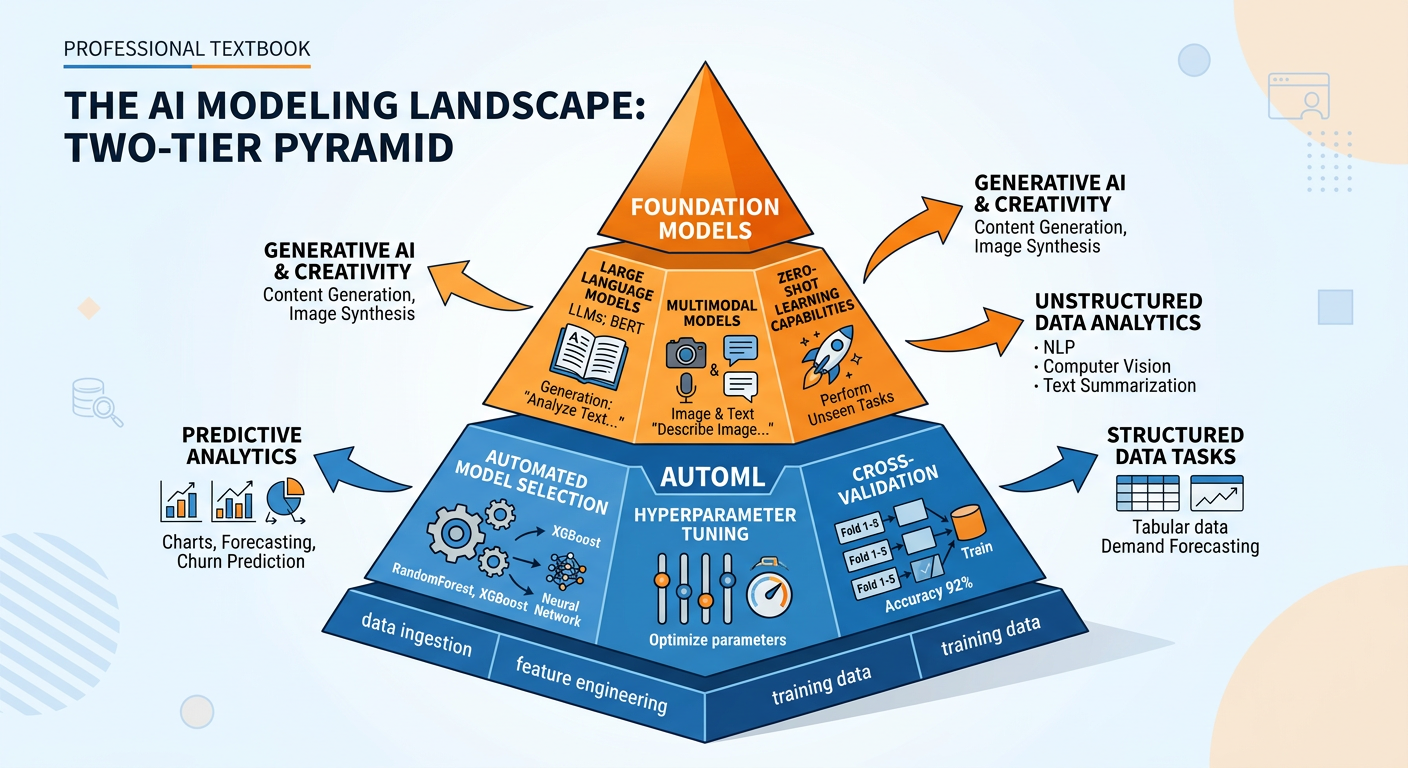
Figure 5:The Two-Tier AI Modeling Revolution: AutoML democratizes traditional machine learning workflows while foundation models enable entirely new categories of analytical tasks.
AutoML: Democratizing Machine Learning. Automated Machine Learning platforms — including Google AutoML, H2O.ai, DataRobot, and Azure Automated ML — automate the most technically demanding aspects of the modeling process: algorithm selection, hyperparameter tuning, cross-validation, and model evaluation. A business analyst with basic data literacy can now build a reasonably performant predictive model without writing a single line of code. For organizations that previously lacked the data science expertise to build ML models, AutoML represents a genuinely transformative capability.
Foundation Models: A Paradigm Shift. The emergence of large language models (LLMs) and other foundation models represents something more radical than automation — it represents a new paradigm for how AI systems are built and deployed. Rather than training a specialized model for each specific task, foundation models are pre-trained on vast corpora of data and can be adapted — through prompting, fine-tuning, or retrieval augmentation — to a remarkably broad range of tasks with minimal additional training.
For business analytics, foundation models enable use cases that were simply not possible with traditional analytics tools:
Unstructured Data Analysis: LLMs can extract structured insights from unstructured text — customer reviews, support tickets, earnings call transcripts, legal documents — at a scale and speed that makes it economically viable to incorporate these rich data sources into analytical workflows.
Multi-Modal Analytics: Newer foundation models can process images, audio, and video alongside text and tabular data, opening entirely new analytical dimensions for industries like retail (visual merchandising analysis), healthcare (medical imaging analytics), and media.
Reasoning Under Uncertainty: Advanced LLMs demonstrate sophisticated reasoning capabilities that allow them to make nuanced analytical inferences — connecting patterns across domains, generating hypotheses, and evaluating alternative explanations — in ways that complement traditional statistical methods.
4.55.3.5 Visualization and Storytelling: Generative AI Meets Data Communication
Data visualization and storytelling were once the final creative act of the analytics workflow — the stage where technical skill gave way to artistic judgment and communication craft. AI has now entered this domain as well, with significant implications.
AI-Generated Visualizations. Tools like Tableau’s Explain Data feature, Microsoft Copilot for Power BI, and platforms like Flourish with AI assistance can automatically recommend appropriate visualization types based on data characteristics and business context, generate initial visualizations from natural language descriptions, and even write accompanying narrative summaries.
Automated Report Generation. Generative AI tools can now produce complete analytical reports — structured with executive summaries, key findings, methodology descriptions, and recommendations — from raw analytical outputs. What once took an analyst hours of writing and formatting can be accomplished in minutes with AI assistance.
4.65.3.6 Decision Support and Strategy: From Dashboards to Intelligent Systems
The final stage of the analytics workflow — delivering insights to decision-makers — has been transformed from a periodic reporting function into a continuous, intelligent decision support capability.
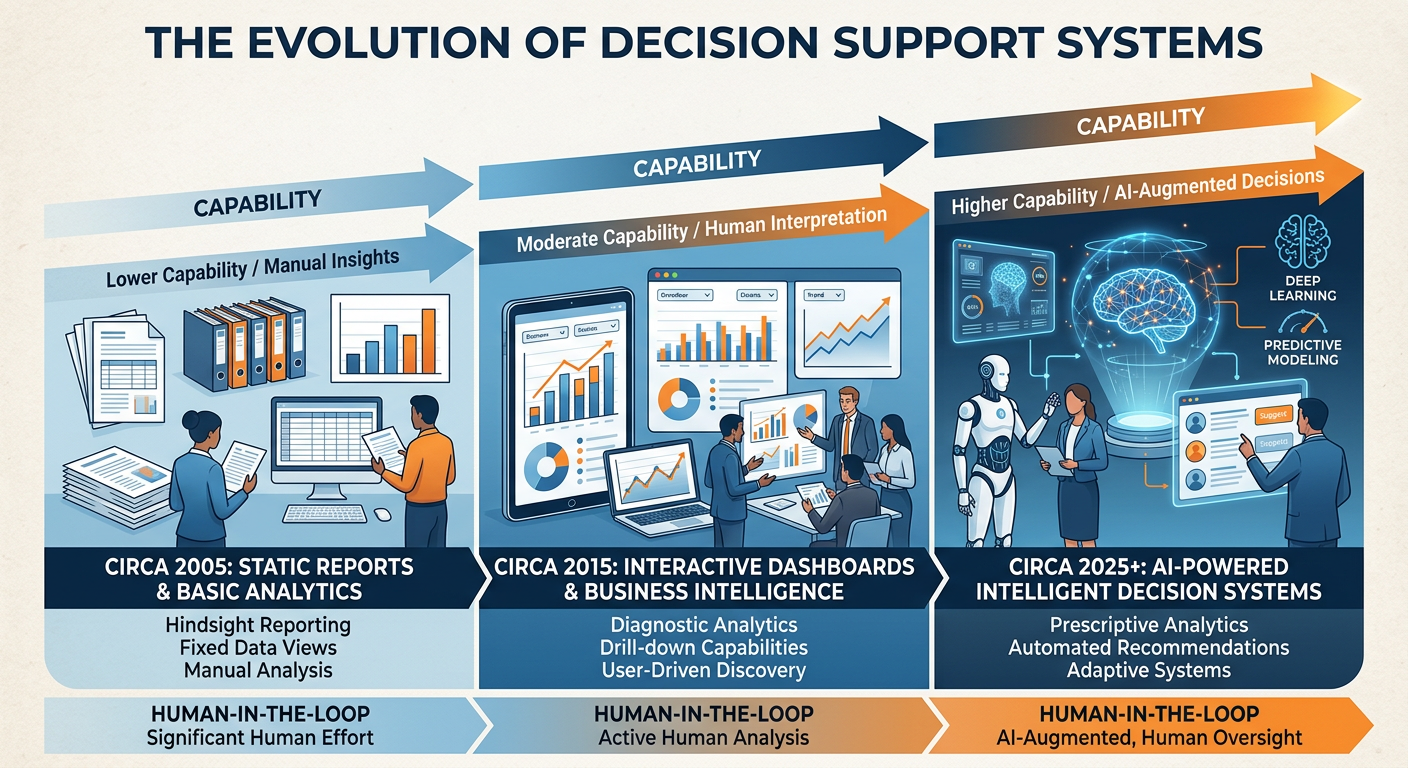
Figure 6:The Evolution of Decision Support: From static historical reports to AI-powered systems that continuously generate, evaluate, and communicate decision-relevant insights.
Traditional dashboards were passive — they displayed information that human decision-makers had to interpret and act upon. AI-powered decision support systems are increasingly active: they monitor data streams in real time, detect decision-relevant signals, generate recommended actions with supporting rationale, and in some domains, execute decisions autonomously within defined parameters.
Consider a concrete example: retail inventory management. In the traditional model, an inventory analyst would review weekly sales reports, consult seasonal trend data, and submit manual purchase orders to replenish stock. An AI-powered inventory system continuously ingests sales data, external signals (weather, local events, competitor pricing), and supply chain status, and automatically generates — or in some systems, automatically executes — replenishment orders optimized for multiple simultaneous objectives: stockout prevention, carrying cost minimization, and cash flow optimization.
55.4 The Human-AI Collaboration Framework: Augmented Intelligence
**A ** critical concept for every analytics professional in the AI era is the distinction between artificial intelligence that automates human analytical work and artificial intelligence that augments it. This distinction has profound implications for how organizations deploy AI, how analytics professionals position their careers, and how businesses navigate the ethical complexities of AI-driven decisions.
The augmented intelligence framework recognizes that humans and AI systems have complementary strengths. AI excels at processing large volumes of data rapidly, identifying statistical patterns, maintaining consistency across millions of decisions, and operating continuously without fatigue. Humans excel at applying contextual judgment, navigating ethical complexity, integrating qualitative and quantitative information, and adapting to genuinely novel situations that fall outside historical training data.
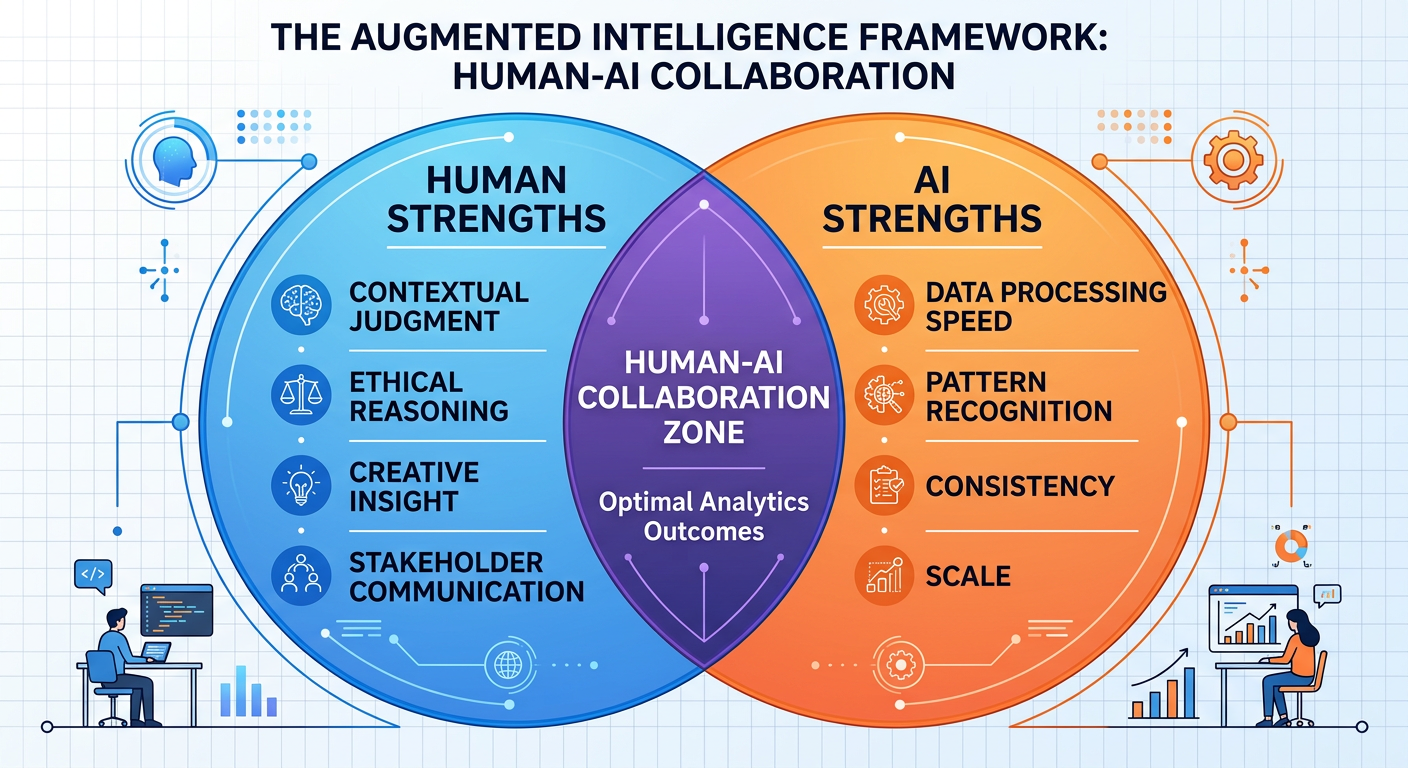
Figure 7:The Augmented Intelligence Framework: Optimal analytics outcomes emerge from the deliberate combination of human and AI capabilities, leveraging the complementary strengths of each.
The most sophisticated organizations are those that have thoughtfully designed their analytics workflows to leverage these complementary strengths — deploying AI where it has clear comparative advantage and preserving human judgment where the stakes, the context, or the ethical complexity demand it.
65.5 Organizational Implications: Roles, Teams, and Workflows
The AI disruption of analytics workflows is not merely a technical phenomenon — it is fundamentally restructuring how analytics functions are organized, staffed, and managed within enterprises.
6.15.5.1 The Evolving Analytics Role Landscape
Several new professional roles have emerged at the intersection of AI and business analytics:
The Analytics Translator. One of the most important emerging roles in enterprise analytics is the analytics translator — a professional who bridges the gap between technical AI/ML capabilities and business unit needs. Translators do not necessarily build models; they understand what AI can and cannot do, identify high-value opportunities for AI application, and work with technical teams to ensure that models are solving the right problems. McKinsey has identified this role as one of the most scarce and valuable in the current talent market.
The Prompt Engineer / AI Workflow Specialist. As generative AI tools become embedded in analytics workflows, professionals who can design effective prompting strategies, build AI-augmented analytical pipelines, and evaluate the quality of AI-generated analytical outputs are in growing demand.
The AI Ethics and Governance Analyst. Every organization deploying AI in analytics faces questions of fairness, transparency, accountability, and compliance. Dedicated roles focused on AI governance — auditing model outputs for bias, ensuring regulatory compliance, and communicating AI limitations to stakeholders — are rapidly proliferating.
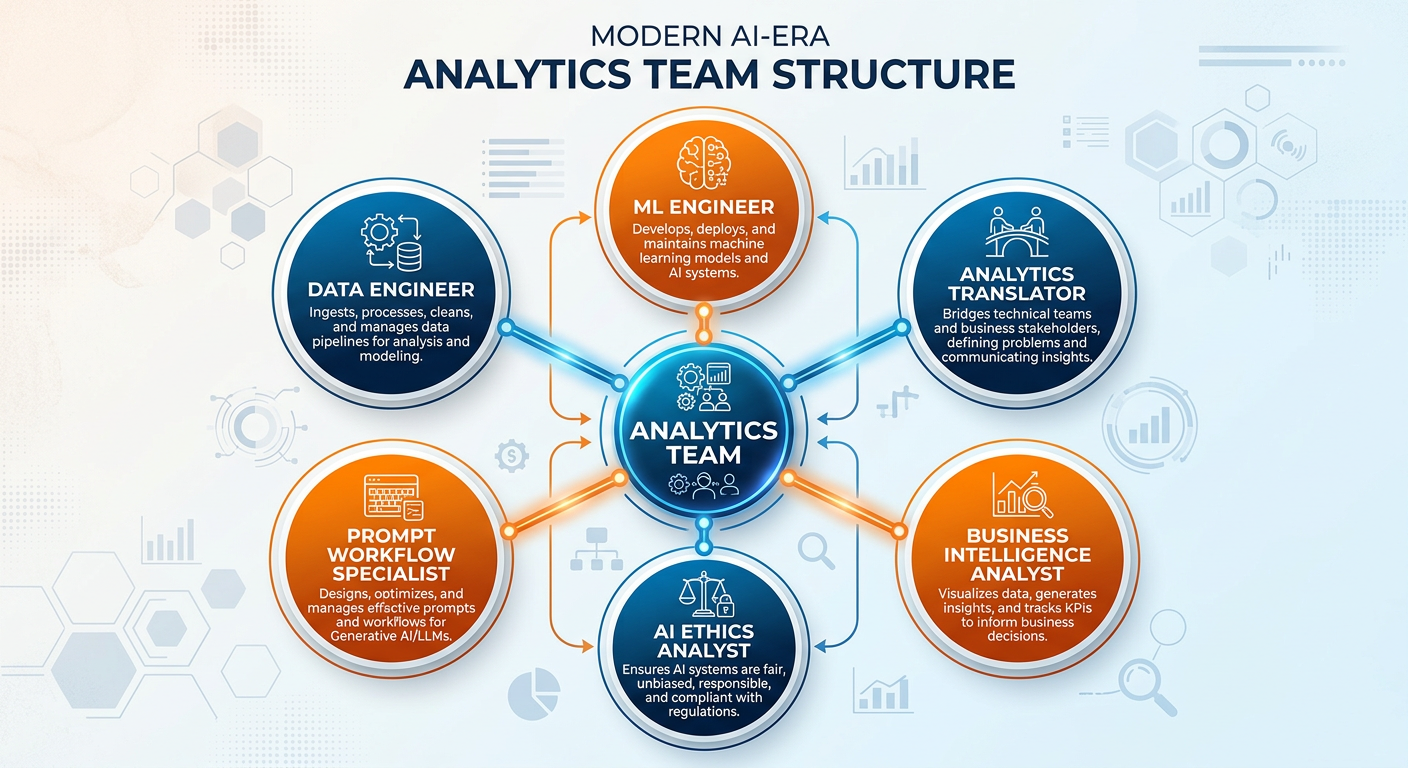
Figure 8:The Modern Analytics Team: AI has not eliminated the need for analytics talent — it has restructured the team composition, creating new specialized roles while transforming the responsibilities of traditional ones.
6.25.5.2 The Democratization Paradox
The democratization of analytics through AI creates a significant organizational tension that management scholars have begun calling the democratization paradox. On one hand, AI tools lower the barrier to analytical work, enabling more people across the organization to engage in data-driven decision-making — a broadly positive development. On the other hand, widespread access to analytical tools without corresponding analytical literacy can produce a dangerous proliferation of flawed analyses, misinterpreted outputs, and overconfident conclusions dressed up in the credibility of AI-generated outputs.
6.35.5.3 From Project-Based to Continuous Analytics
One of the most significant organizational shifts driven by AI is the move from project-based analytics to continuous analytics. In the traditional model, analytics was conducted in discrete projects: the marketing team requested an analysis, the analytics team delivered it six weeks later, and that report informed strategy for the next quarter. AI enables a fundamentally different operating model: continuous, automated analytics pipelines that monitor business performance in real time, generate alerts when conditions change, and continuously update models as new data arrives.
This shift has profound implications for how analytics teams are structured and how they interact with the rest of the organization. Rather than functioning as an internal consulting firm that takes on discrete projects, the analytics function increasingly resembles a real-time intelligence operation — more like a newsroom than a think tank.
75.6 Challenges, Risks, and Ethical Considerations
No chapter on AI’s impact on business analytics would be complete without a serious treatment of the challenges and risks that AI introduces. The analytics profession has an ethical obligation to be clear-eyed about these issues.
7.15.6.1 Algorithmic Bias and Fairness
Machine learning models learn from historical data, and historical data reflects historical human decisions — decisions that may have been systematically biased against certain groups. When AI models are trained on such data, they can perpetuate and even amplify these biases at scale and speed.
The stakes are not abstract. In credit lending, AI models that are trained on historical approval data can perpetuate patterns of racial or gender discrimination. In hiring, AI resume-screening tools have been found to systematically disadvantage women and minority candidates. In criminal justice, predictive policing models have been shown to over-police communities of color. These are not edge cases or hypothetical futures — they are documented failures of AI systems deployed in real organizations.
7.25.6.2 Model Interpretability and the Black Box Problem
Many of the most powerful machine learning models — deep neural networks, gradient boosting ensembles, large language models — are effectively black boxes: they produce outputs, but the reasoning process that generates those outputs is not transparently interpretable. This creates significant challenges in business contexts where decision-makers need to explain and justify analytical conclusions to stakeholders, regulators, or affected parties.
The field of Explainable AI (XAI) has emerged specifically to address this challenge, developing techniques like SHAP (SHapley Additive exPlanations) and LIME (Local Interpretable Model-agnostic Explanations) that provide post-hoc explanations of black-box model outputs. But these techniques are approximations, not true transparency, and analytics professionals should be honest about their limitations.
7.35.6.3 Hallucination and Reliability of Generative AI
Generative AI models, including large language models, have a well-documented tendency to produce outputs that are fluent and confident-sounding but factually incorrect — a phenomenon known as hallucination. In a business analytics context, this risk is particularly concerning. An LLM assisting with statistical analysis might cite incorrect statistical formulas, misinterpret data patterns, or fabricate references to nonexistent studies. An AI code generator might produce code that runs without errors but implements an incorrect analytical logic.
7.45.6.4 Data Privacy and Security in the Age of AI Analytics
As AI analytics capabilities increasingly process sensitive personal data — from customer transactions to employee performance records to patient health information — data privacy concerns become central to analytics governance. Analytics professionals must be conversant with the regulatory landscape (GDPR, CCPA, HIPAA) and understand the technical mechanisms for privacy-preserving analytics, including differential privacy, federated learning, and data anonymization.
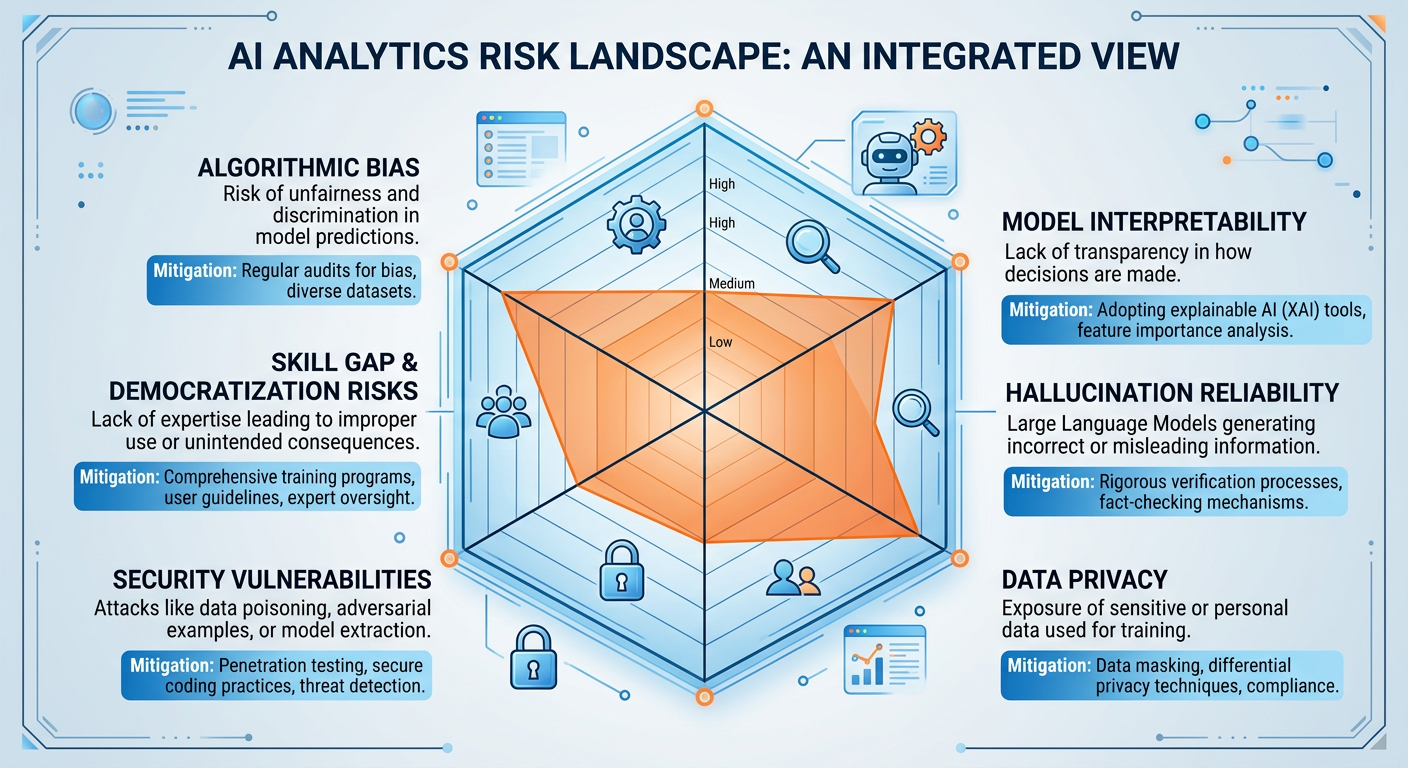
Figure 9:The AI Analytics Risk Landscape: A multidimensional view of the challenges that analytics professionals must navigate when deploying AI in business contexts, along with key mitigation strategies for each risk dimension.
85.7 The Competitive Landscape: Industry Transformation Through AI Analytics
The disruption of analytics workflows by AI is not playing out uniformly across industries. Some sectors have been more aggressive in deploying AI analytics capabilities, and understanding these patterns of adoption is itself an important analytical insight.
Financial Services has been at the forefront of AI analytics adoption, deploying AI for real-time fraud detection, algorithmic trading, credit risk modeling, customer churn prediction, and regulatory compliance monitoring. JPMorgan Chase has expanded far beyond its original COiN (Contract Intelligence) platform, which processes in seconds the legal documents that previously required 360,000 hours of lawyer time annually. By 2025, JPMorgan’s AI initiatives span over 400 deployed use cases, including an LLM-powered equity research assistant, real-time transaction fraud detection processing billions of events daily, and a dedicated AI infrastructure investment exceeding $2 billion annually. The firm’s “IndexGPT” trademark filing and partnerships with OpenAI signal the bank’s ambition to deploy frontier AI models directly in financial advisory and trading operations.
Retail and E-commerce has leveraged AI analytics to transform demand forecasting, personalization, pricing optimization, and supply chain management. Amazon’s recommendation engine, which drives an estimated 35% of the company’s revenue, represents one of the most commercially impactful AI analytics applications in the history of the technology industry. Beyond recommendations, Amazon’s 2025 AI analytics stack includes real-time inventory optimization that dynamically repositions stock across 200+ fulfillment centers based on predicted demand signals, a dynamic pricing engine that executes millions of price changes daily, and an AI-powered return fraud detection system that has substantially reduced losses from abuse of its returns policy.
Healthcare is experiencing a particularly profound transformation. The combination of electronic health records, medical imaging, genomics, and wearable device data creates a text and signal dataset of extraordinary richness and sensitivity. Companies like Epic Systems, Google Health, and a cohort of AI-native health analytics startups are deploying AI to predict hospital readmissions, identify patients at risk of sepsis, optimize surgical scheduling, and detect cancer in medical imaging with accuracy approaching or exceeding specialist radiologists. The FDA’s 2023 and 2024 clearances of numerous AI-assisted diagnostic devices signal a regulatory shift toward embracing AI in high-stakes clinical decision support.
Manufacturing and Supply Chain organizations have deployed AI analytics in production quality inspection (computer vision systems that detect defects with superhuman speed and consistency), predictive maintenance (sensor data analytics that predict equipment failures days before they occur, reducing unplanned downtime by 30–50% in documented deployments), and supply chain risk management (NLP-powered monitoring of global news, shipping data, and supplier financial health to detect supply disruption risks before they materialize in delivery failures).
The pattern across industries is consistent: organizations that move from analytics as a function to analytics as an organizational capability — deeply embedded in every business process, continuously learning, and increasingly augmented by AI — are establishing durable competitive advantages that become harder to close the longer early movers stay ahead.
95.8 Chapter Summary
The impact of AI on business analytics has been nothing less than transformational. In the span of five years, AI has disrupted every stage of the analytics workflow: from intelligent data pipelines that replace manual ETL processes, to AutoML platforms that automate model selection and tuning, to large language models that serve as collaborative analytical research partners, to generative AI systems that translate analytical findings into board-ready narratives. The democratization of analytics — making advanced capabilities accessible to non-specialists — represents both the most exciting opportunity and the most significant organizational challenge of this transformation.
Yet the human analyst remains indispensable. AI tools are powerful accelerants, but they require expert direction, critical validation, and ethical oversight. The analysts who will thrive in the AI era are those who understand what AI can and cannot reliably do, who develop the judgment to know when to trust AI outputs and when to question them, and who combine technical fluency with business acumen and ethical responsibility. The competitive landscape demonstrates that the organizations winning with AI analytics are those that invest not just in technology but in analytical culture — the shared organizational belief that evidence-based decision-making, powered by the right blend of human and machine intelligence, is a core organizational competency.
105.9 Discussion Question: The Democratization Paradox
10.15.9.1 Discussion Prompt
In 2025, Salesforce reported that its Einstein AI platform — integrated directly into its CRM product used by over 150,000 companies — had enabled business users with no data science background to build predictive models, generate AI-powered customer engagement recommendations, and automate analytical workflows previously requiring specialist skills. The company described this as “analytics for everyone.”
Simultaneously, a major consulting firm’s annual analytics talent survey found that the demand for senior data scientists with advanced statistical training, causal inference skills, and AI governance expertise had increased by 35% year-over-year, with compensation for top-tier quantitative analysts reaching all-time highs. The report’s authors described a “barbell market” — strong demand at the specialist extreme, strong demand at the citizen-analyst middle, and a hollowing out of the intermediate analyst tier.
Drawing on the concepts in this chapter, critically analyze the following:
The democratization of AI analytics tools is frequently described as unambiguously positive because it expands access and accelerates decision-making. What are the genuine risks of empowering business users with powerful AI analytics tools without the statistical and methodological background to understand their limitations? Draw on at least two specific examples or failure modes discussed in this chapter.
How should an organization structure its analytics talent strategy in response to the “barbell market” described above? What mix of citizen analysts, analytics translators, and deep specialists does an organization need, and how should these roles be organized and governed?
AutoML platforms like H2O.ai, Google AutoML, and DataRobot can automatically select, train, tune, and even deploy machine learning models with minimal human input. Under what circumstances is it responsible to deploy an AutoML-generated model for a business decision — and under what circumstances is expert oversight non-negotiable? Where do you draw the line, and why?
Your response should be approximately 400–600 words. Be prepared to discuss your position in class and to defend it against alternative perspectives.
10.2📝 Discussion Guidelines
Primary Response: Your initial post must address all parts of the prompt with depth and critical thinking. It must include at least one citation (scholarly or credible industry source) to support your argument.
Peer Responses: You must respond thoughtfully to at least two of your peers. Your responses must go beyond simple agreement (e.g., “I agree with your point”) and add substantial value to the conversation by offering an alternative perspective, sharing related research, or asking a challenging follow-up question.
115.10 Chapter Quiz
Instructions: Answer all 10 questions. Questions are a mix of multiple choice, true/false, and short answer. This quiz covers all sections of Chapter 5.
Question 1 According to the chapter, the traditional analytics workflow is characterized by which fundamental bottleneck that AI tools have partially addressed?
A) Insufficient computing hardware for large datasets
B) The excessive time analysts spend on data preparation rather than higher-value analytical work (the “80% problem”)
C) The inability of traditional statistical methods to handle more than three variables simultaneously
D) The lack of visualization tools capable of rendering complex multidimensional data
Question 2 True or False: AutoML platforms have made human data scientists obsolete because they automate all steps of the model development process, including problem formulation, feature engineering, model validation, and business interpretation.
Question 3 A retail company deploys an AI-powered demand forecasting model that was trained entirely on historical sales data from 2015 to 2023. The model performs poorly in 2024. Which concept most directly explains this failure?
A) Overfitting to the training data
B) Distribution shift — the 2024 data reflects patterns (post-pandemic consumer behavior changes, supply chain restructuring) not present in the training period
C) Insufficient model complexity — a deeper neural network would resolve the problem
D) Hallucination — the model is generating false predictions
Question 4 Describe the “Democratization Paradox” as discussed in Chapter 5. What is the central tension, and what organizational or governance mechanisms can help resolve it?
Question 5 Which of the following best describes the role of Explainable AI (XAI) techniques like SHAP and LIME in enterprise analytics?
A) They replace black-box models with inherently interpretable models that always achieve equal predictive accuracy
B) They provide post-hoc approximations of why a black-box model produced a specific output, enabling better human oversight without replacing expert judgment
C) They are regulatory requirements for all AI models deployed in the United States as of 2025
D) They eliminate the possibility of algorithmic bias by identifying and removing discriminatory features from the model
Question 6 True or False: According to the chapter, Large Language Models (LLMs) are reliable sources of factual statistical information and can be trusted without verification when used to assist with quantitative analytical tasks.
Question 7 A healthcare analytics team is building an AI model to predict patient readmission risk. The model achieves 91% accuracy on the held-out test set. Before deploying the model in a clinical setting, what are three critical validation and governance steps the team should take? For each step, explain why it is necessary in this specific context.
Question 8 Explain the concept of “augmented intelligence” as it applies to the human-AI collaboration framework in analytics. How does augmented intelligence differ from the premise of full automation, and why do the chapter’s authors argue it is a more appropriate design philosophy for high-stakes business analytics applications?
Question 9 The chapter discusses how AI is transforming the analytics role landscape. Which of the following describes the “analytics translator” role that has grown in importance in AI-era analytics organizations?
A) A software engineer who translates machine learning code between Python and R
B) A professional who bridges the gap between data science teams and business stakeholders, translating technical analytical findings into business-relevant recommendations and ensuring business questions are appropriately framed for analytical teams
C) An AI model that automatically generates natural language summaries of dashboard data for non-technical executives
D) A compliance officer who reviews AI model outputs for regulatory conformance before deployment
Question 10 You are advising a mid-sized insurance company (approximately 500 employees, $200M annual revenue) that wants to build its first AI-powered analytics capability. Leadership is excited about the potential but lacks a clear strategic framework. Drawing on the chapter’s discussion of organizational implications, human-AI collaboration, and risk management, write a 300-400 word strategic recommendation that covers: (a) where to start given their likely resource constraints, (b) what governance structures they should establish before deploying any AI model in a decision-affecting role, (c) how to build analytical talent and culture over a 3-year horizon, and (d) what risks they should explicitly plan to manage.
125.11 Building an AI-Ready Analytics Organization
12.15.11.1 The Infrastructure Foundation
The most powerful AI analytics capabilities in the world will underperform in organizations with weak data infrastructure. Before investing in cutting-edge AI tools, organizations must ensure they have mastered the foundational infrastructure layers that AI systems depend on.
Data Quality and Governance: AI models are only as good as the data they train on and operate with. Organizations that have not invested in data quality management — consistent data definitions, master data management, automated quality monitoring, and clear data lineage documentation — will find that AI amplifies their data problems rather than solving them. A credit risk model trained on inconsistently defined “default” events will produce inconsistently meaningful predictions. Garbage in, garbage out remains the most enduring principle in all of data science, regardless of how sophisticated the model architecture becomes.
Modern Data Stack: The contemporary analytics data architecture — often called the “modern data stack” — centers on cloud-native data warehouses (Snowflake, Google BigQuery, Amazon Redshift, Databricks) that separate storage from compute, enabling elastic scaling for AI workloads. This architecture replaced the on-premise data warehouse paradigm that dominated analytics infrastructure from the 1990s through the 2010s. Organizations still running legacy on-premise data warehouses face significant competitive disadvantages in deploying AI analytics, both in capability and in cost.
MLOps: Machine Learning Operations (MLOps) refers to the practices, tools, and cultural norms for managing the full lifecycle of ML models in production — from experiment tracking and model registry through automated deployment, monitoring, and retraining. Without MLOps, organizations accumulate “model debt”: a proliferation of models that nobody knows who owns, what data they were trained on, whether they are still accurate, or what decisions they are actually influencing. Platforms like MLflow, Weights & Biases, and the MLOps features built into cloud AI platforms (SageMaker, Vertex AI, Azure ML) address this problem. MLOps maturity is increasingly a requirement for AI governance compliance under emerging regulatory frameworks.
12.25.11.2 The Cultural Dimension: Building an Analytics Mindset
Technical infrastructure and AI tools are necessary but insufficient conditions for an AI-ready analytics organization. The most overlooked enabler of analytics transformation is culture — specifically, the organizational belief that evidence-based decision-making is both possible and expected at every level of the organization.
In 2025, Bain & Company’s analytics maturity research identified “leadership analytics mindset” as the single strongest predictor of analytics capability maturity — stronger than technology investment, stronger than talent acquisition, and stronger than organizational structure. Leaders who model data-driven decision behavior, who ask “what does the data show?” before “what do my instincts say?”, who reward analytical rigor even when the findings are unwelcome, and who invest in building analytical literacy across the organization create the conditions for analytics capabilities to compound over time.
Conversely, organizations where data is used primarily to post-rationalize decisions already made, where analytics teams are brought in after major strategic choices rather than before, and where inconvenient analytical findings are ignored or buried, cannot sustain world-class analytics capabilities regardless of their technology investments. The best analysts leave; the worst ones learn to tell the story leadership wants to hear.
12.35.11.3 Measuring the ROI of AI Analytics
A persistent challenge for analytics leaders is demonstrating the business value of AI analytics investments in a way that satisfies the scrutiny of CFOs and boards. The challenge is partly methodological: analytics improvements often improve decisions rather than directly driving revenue, and attributing business outcomes to specific analytical capabilities requires a level of causal rigor that is itself an advanced analytical task.
Proven approaches to measuring analytics ROI include: A/B testing of AI-assisted vs. baseline decisions (randomize which decisions benefit from the AI model and compare outcomes), holdout analysis (compare outcomes for a sample of decisions that did not use the model against those that did), time-series interrupted analysis (compare business metrics before and after a major AI analytics deployment, controlling for other changes), and shadow deployment (run the AI model in parallel with the current process without acting on its outputs, to quantify the predicted improvement before committing to change).
Organizations that discipline themselves to measure analytics ROI rigorously build two durable advantages: they generate the evidence needed to secure continued investment, and they develop the organizational muscle to distinguish analytics investments that create real value from those that create impressive-looking dashboards without measurable business impact.
135.12 Hands-On Activity: Audit an AI Analytics Tool
13.15.12.1 Activity Overview
This activity asks you to critically evaluate an AI analytics tool — one that you use yourself or that is deployed in an organization you are familiar with — through the lens of the concepts covered in this chapter. The goal is to move from passive consumption to active critical analysis of the AI tools that now pervade the analytics landscape.
Learning Objectives:
Apply the human-AI collaboration framework to a real tool evaluation
Identify specific risks and limitations in a commercial AI analytics product
Practice the analytical habit of structured critical thinking about technology claims
Estimated Time: 60–90 minutes
Deliverable: A 500-700 word critical evaluation memo
13.25.12.2 Activity Instructions
Step 1: Choose Your Subject. Select an AI analytics tool that falls into one of these categories:
An AutoML or automated modeling platform (H2O.ai, Google AutoML, DataRobot, RapidMiner)
An AI-augmented BI tool (Power BI Copilot, Tableau AI, Looker with Gemini)
An AI data preparation tool (Alteryx AI, Trifacta/Dataprep)
A generative AI tool you have used for analytical tasks (Claude.ai, Gemini Advanced, ChatGPT with data analysis)
Step 2: Conduct Your Evaluation. Interact with the tool directly, or — if you cannot access the tool itself — research it through vendor documentation, independent reviews, and academic evaluations. Address the following:
Capability Assessment. What specific analytical workflow stages (data preparation, EDA, modeling, visualization, interpretation) does this tool address? For each stage it touches, describe what it does and how it does it.
Augmentation vs. Automation. Using the chapter’s human-AI collaboration framework, characterize the design philosophy of this tool. Does it position itself as augmenting the analyst (keeping humans in control, providing suggestions and acceleration) or automating analyst functions (replacing human judgment with algorithmic decisions)? Provide specific feature examples to support your characterization.
Risk and Limitation Analysis. Identify at least three specific risks or limitations of this tool based on the challenges discussed in Chapter 5: algorithmic bias, hallucination, black-box interpretability, democratization risks, or others. For each risk, describe a specific scenario in which it could materialize in real business use.
Governance Recommendation. What organizational controls, validation steps, or governance policies would you recommend before deploying this tool in a decision-affecting analytical role? Be specific — generic answers (“ensure human oversight”) do not demonstrate analytical depth.
Step 3: Write Your Evaluation Memo. Structure your 500-700 word memo as a professional recommendation to a hypothetical VP of Analytics who is evaluating whether to standardize on this tool across the analytics organization. Lead with your overall recommendation, support it with your analysis from Steps 1-3, and close with your governance recommendations.
145.13 Chapter Summary: The Transformation Continues
The transformation of business analytics by AI is not a completed event but a continuing process. As of 2026, organizations across every industry are still in the early-to-middle stages of incorporating AI into their analytics workflows, governance structures, and talent strategies. The competitive advantages available to early movers remain available to organizations that commit to the transformation with appropriate investment and seriousness.
The key themes of this chapter are worth restating as a synthesis: AI has disrupted every stage of the analytics workflow, from data preparation through modeling through visualization and decision support. This disruption has democratized some capabilities while increasing the premium on others. The human analyst’s role has shifted from execution toward judgment, curation, and governance — functions where human capabilities remain essential and where the stakes of errors are highest. The risks of AI analytics — bias, hallucination, interpretability gaps, privacy vulnerabilities — are real and require active management through governance structures that most organizations are still building. And the competitive landscape shows clearly that organizations treating AI analytics as a genuine strategic priority rather than a technology experiment are establishing durable advantages.
For the individual analyst, the message is equally clear: the AI era is an era of opportunity for those who approach it with intellectual curiosity, ethical seriousness, and the willingness to continuously adapt. The tools will keep changing. The judgment required to use them well is yours to build.