“Revenue is vanity. Profit is sanity. Cash is reality. Unit economics is the bridge between all three.”
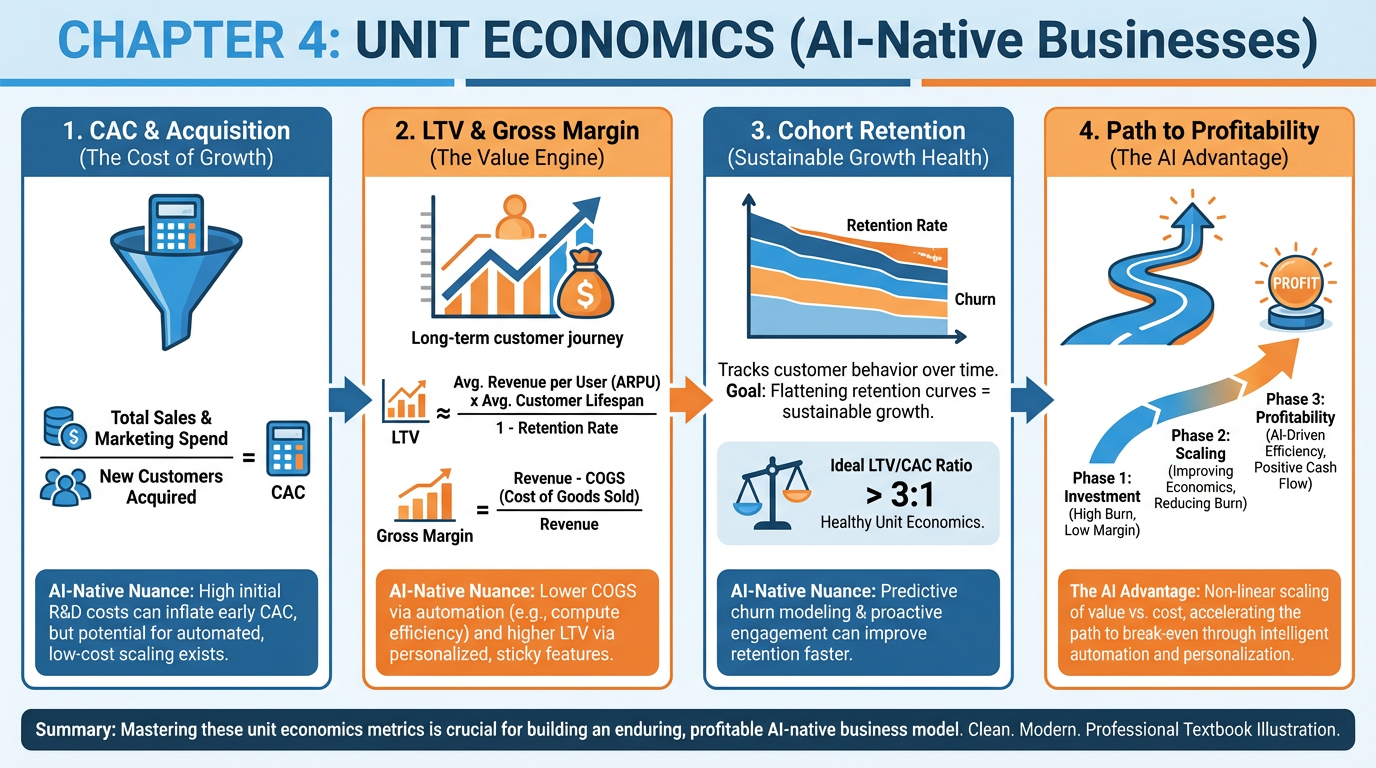
Figure 1:A comprehensive overview of Chapter 4: the five core unit economics metrics, cost structure in AI-native businesses, cohort retention analysis, path to profitability, and financial modeling with AI.
1Learning Objectives
By the end of this chapter, you will be able to:
Calculate CAC, LTV, LTV/CAC ratio, payback period, and gross margin — and explain why the gross-margin version of LTV is the only version that matters.
Diagnose the AI gross margin squeeze and evaluate when self-hosting beats API procurement.
Build a cohort retention model that distinguishes logo churn from revenue churn, and explain what net revenue retention reveals about a company’s long-term prospects.
Construct an 18-month path to profitability with quantified milestones at Months 3, 6, 12, and 18.
Use AI to generate, stress-test, and critically read financial assumptions — and identify the single variable that most moves payback period in your own model.
Analyze Figma’s unit economics to understand how product-led growth can produce elite retention that justifies premium valuations.
24.1 The Core Metrics
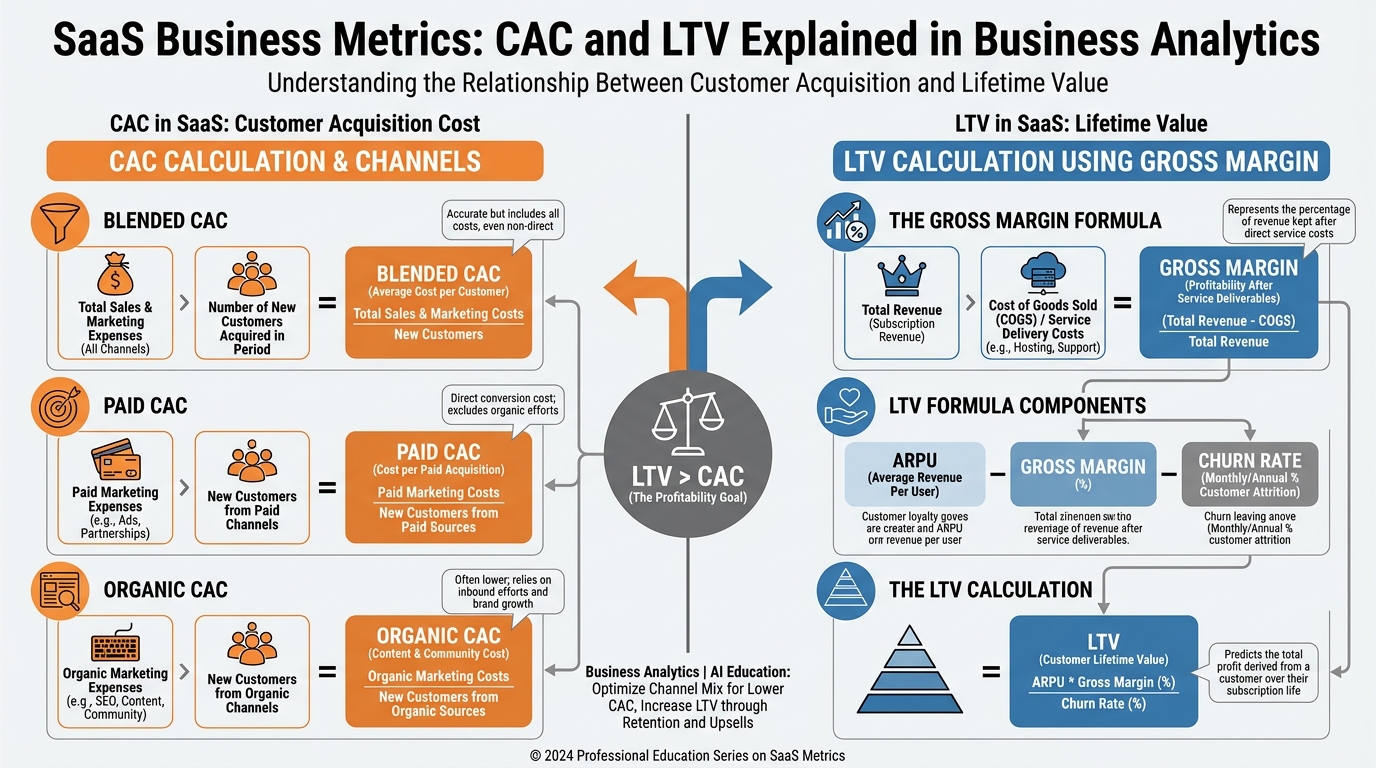
Figure 2:CAC and LTV are a pair, not separate calculations. CAC tells you what you paid to acquire the customer; LTV (gross-margin version) tells you what that customer is actually worth. The gap between them — and how long it takes to close — determines whether you have a business or an expensive hobby.
Unit economics is the analysis of revenue and costs at the level of a single customer. Everything in this chapter scales up from that single relationship: one customer, one acquisition cost, one revenue stream, one set of costs to serve. If the math works at the unit level, you have a business. If it does not, no amount of growth makes it better — growth only makes the bleeding faster.
2.1Customer Acquisition Cost (CAC)
CAC is the fully loaded cost to acquire one paying customer. The formula is deceptively simple:
The nuance is in what counts as “sales and marketing spend.” Founders routinely undercount. A complete numerator includes:
Paid media (search, social, display)
Sales headcount (salaries, commissions, benefits — fully loaded)
Marketing headcount (same)
Tools and software used by sales and marketing
Agency fees, contractors
Event costs, trade shows, content production
Blended CAC treats all acquisition channels as one pool. Paid CAC isolates customers who came through paid channels only. Organic CAC accounts for the real cost of organic channels — which is never zero, because someone is writing the blog posts, recording the podcasts, and building the SEO infrastructure.
Worked Example: A B2B SaaS startup spent $120,000 on sales and marketing last quarter and acquired 40 new customers.
If 25 of those 40 came through paid channels that cost $75,000:
In this example they’re equal — a coincidence. In most companies, organic CAC is lower than paid CAC, which is why investors ask about “organic as a percentage of acquisition.” A growing organic mix is a signal of brand equity and content moat building.
2.2Lifetime Value (LTV) — The Gross Margin Version
Most textbooks define LTV as average revenue per customer divided by churn rate. Do not use that definition. It overstates value by ignoring the cost to serve.
Gross-margin LTV is the only version that supports real financial decisions:
Where ARPU is average revenue per user per month.
Worked Example: A startup has ARPU of $500/month, gross margin of 65%, and monthly churn of 2%.
Using revenue-only LTV (25,000) would overstate value by $8,750 — a 54% inflation. That gap is the cost to serve, and it is real.
2.3LTV/CAC Ratio
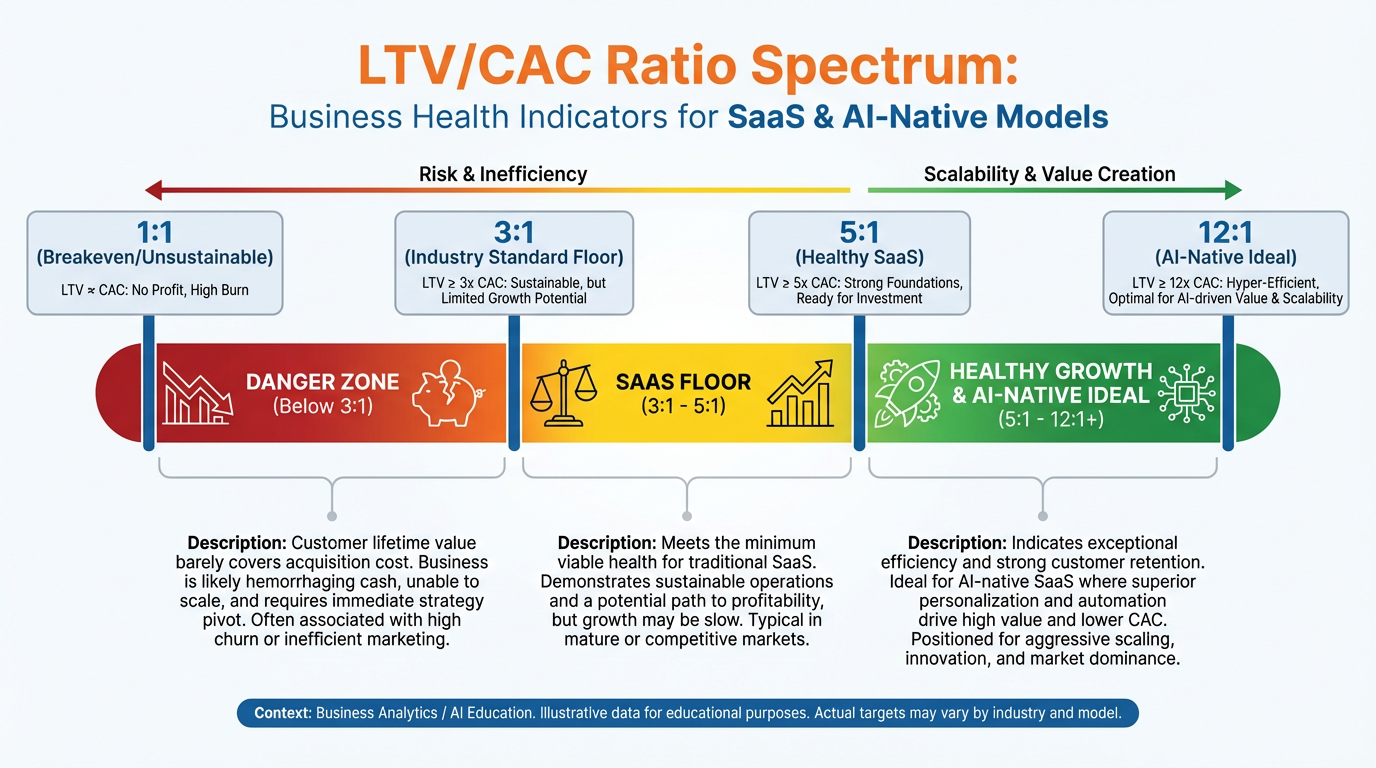
Figure 3:The LTV/CAC spectrum. Below 3:1, you are destroying value with every customer you acquire. Between 3:1 and 5:1 is viable but not fundable at premium valuations. The 5:1 to 12:1 range is where AI-native founders should be targeting. Above 12:1 often signals underinvestment in growth — you could be acquiring faster.
The LTV/CAC ratio is the most widely used single indicator of business model health:
Interpretation:
Below 1:1 — You lose money on every customer. Stop acquiring customers until the model changes.
1:1 to 3:1 — Marginally viable. The market will not fund you at scale.
3:1 — The institutional floor. Below this, sophisticated investors decline.
5:1 to 12:1 — The range AI-native companies should target. Strong enough to justify growth capital; not so high that you’re leaving acquisition on the table.
Above 12:1 — Often signals a growth bottleneck. You may be underinvesting in sales and marketing.
2.4Payback Period
Payback period is the number of months required to recover CAC from gross profit generated by the customer:
Worked Example:
Why 12 months is the institutional cutoff: Enterprise SaaS investors — growth equity, late-stage venture — use 12 months as a heuristic. If your payback period exceeds 12 months, your capital efficiency story weakens significantly. You are holding cash hostage for more than a year before each customer becomes a cash generator. At 24 months, you need extraordinary LTV or extraordinary retention to compensate.
Consumer-focused AI applications often face different economics: lower ARPU, potentially lower CAC through viral loops, and high churn. The payback math there can look terrible at the unit level but work at the portfolio level — which is why consumer unit economics require separate treatment from enterprise.
2.5Gross Margin: The AI-Native Obsession
Gross margin for a software business is:
Traditional SaaS COGS include hosting, support, and payment processing — typically landing at 70–80% gross margins. AI-native businesses have an additional COGS line that traditional SaaS did not: inference costs. Every time your product calls an LLM, you pay. That cost appears directly in COGS and compresses gross margin.
This compression is the defining financial challenge of AI-native product development. A company that builds a product at 45% gross margin is raising capital at a structural disadvantage. The entire remainder of this chapter is, in part, about managing that compression.
34.2 Cost Structure in AI-Native Businesses
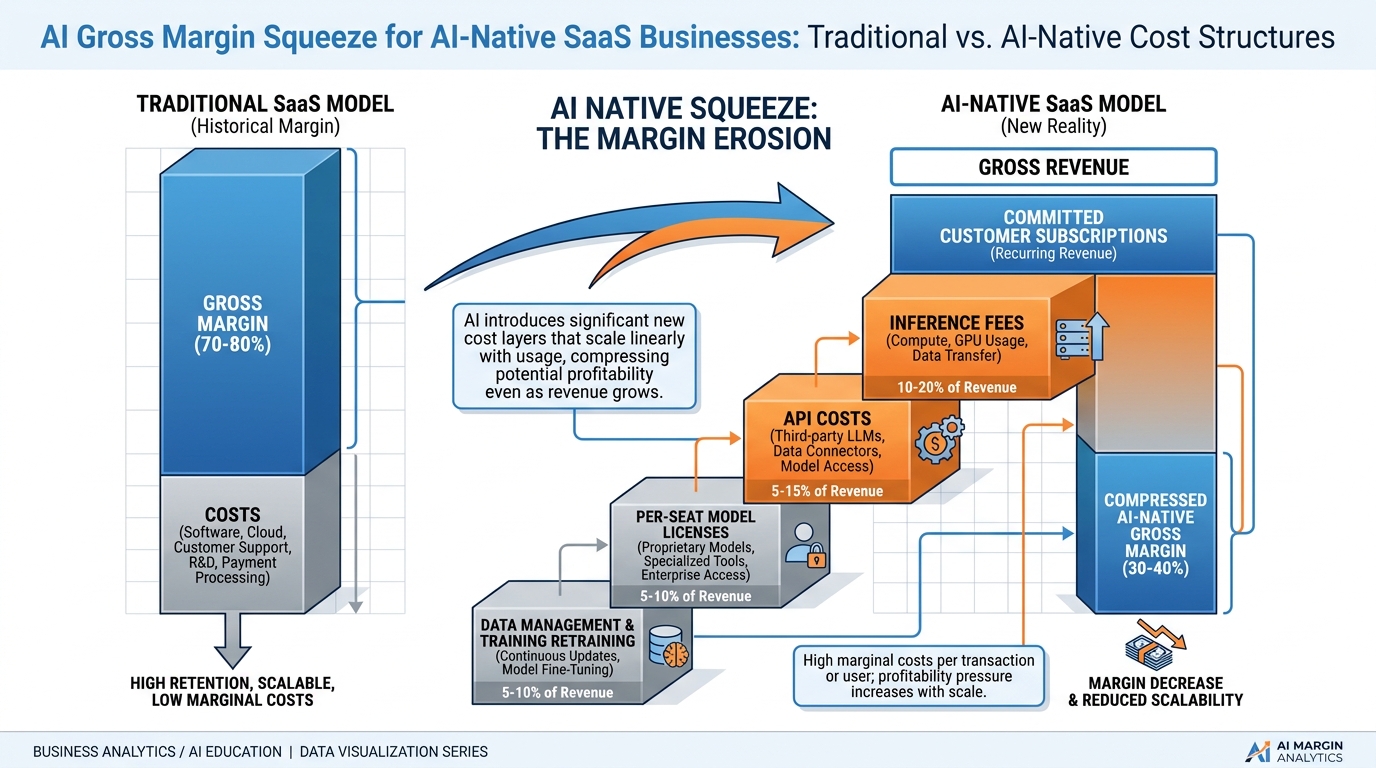
Figure 4:The AI gross margin squeeze. Traditional SaaS achieves 70–80% gross margins with hosting, support, and payment processing as the primary COGS. AI-native businesses add inference fees, API call costs, and per-seat model licenses — compressing margins to 40–60% in early stages before optimization.
3.1Variable Costs: The New COGS
AI-native businesses carry three variable cost layers that traditional SaaS did not:
1. Inference fees. Every LLM call costs money. The cost depends on model size (number of parameters), token count (input + output), and provider pricing. A product that makes five LLM calls per user session, at average cost of 0.10 in inference COGS per session. If the average user has 30 sessions per month and pays 3.00 in inference cost on $29 revenue — roughly 10% of revenue gone before you touch hosting, support, or engineering. This is survivable. But if the model calls are heavier — long-context analysis, multi-step agents, vision tasks — the inference bill climbs fast.
2. API calls. Most AI products are orchestration layers over multiple APIs: LLM providers, vector databases, search APIs, data enrichment, payment processors, communication services. Each has per-call pricing. Founders routinely underestimate these costs in their unit economics models because they model the happy path (five calls per session) and not the long tail (a small percentage of users who run 200 calls per session and cost 40x the average).
3. Per-seat model licenses. Some AI capabilities — specialized models for legal, medical, code, or finance — are licensed on a per-seat basis from providers. These function as a minimum COGS floor regardless of usage, creating cost even for inactive accounts.
3.2The AI Gross Margin Squeeze Problem
Here is the math that keeps AI founders awake:
| Cost Item | Traditional SaaS | AI-Native SaaS |
|---|---|---|
| Hosting / Cloud Infra | 8–12% of revenue | 8–12% of revenue |
| Inference (LLM calls) | 0% | 5–20% of revenue |
| API calls (third-party) | 1–3% of revenue | 3–8% of revenue |
| Support & CS | 3–5% of revenue | 3–5% of revenue |
| Gross Margin | 70–85% | 50–70% (early) |
The good news: inference costs compress over time. Model efficiency improves, cheaper models catch up to frontier quality for most use cases, and caching frequently-called outputs reduces redundant calls. Companies that track and optimize their inference spend aggressively can recover 10–20 margin points over 18–24 months.
3.3Fixed Costs: The Real Burn Drivers
The three major fixed cost categories for AI-native startups:
Engineering. Senior ML engineers, LLM integration developers, and infrastructure engineers command premium compensation. This is often the single largest fixed cost and scales with team size more than revenue.
Compliance and legal. Heavily regulated verticals (healthcare, finance, legal) require compliance infrastructure — data handling, audit logging, privacy reviews, legal counsel — that is largely fixed regardless of revenue scale.
Infrastructure. Database costs, monitoring, CI/CD, security tooling. These scale, but they scale in steps, not linearly.
3.4The Hidden Cost Line: Evals, Safety, and Trust & Safety
This is the cost that founders discover late and investors ask about early: the operational cost of making AI outputs trustworthy.
Evaluation (evals) pipelines: Automated and human review of model outputs to catch regressions, hallucinations, and quality degradation. As your product handles more queries and more edge cases, eval infrastructure grows.
Safety staffing: For consumer-facing AI products, trust and safety teams review flagged outputs, handle appeals, and build policy frameworks. This is a largely fixed cost that appears whether you have 100 users or 100,000.
Red-teaming and adversarial testing: Periodic exercises to find ways your product can be misused or manipulated. Some teams pay external red-teamers; others staff this internally.
These costs are rarely modeled in seed-stage financial models. They materialize at Series A scale. Founders who have planned for them are measurably more fundable.
3.5Self-Host vs. Buy API Capacity
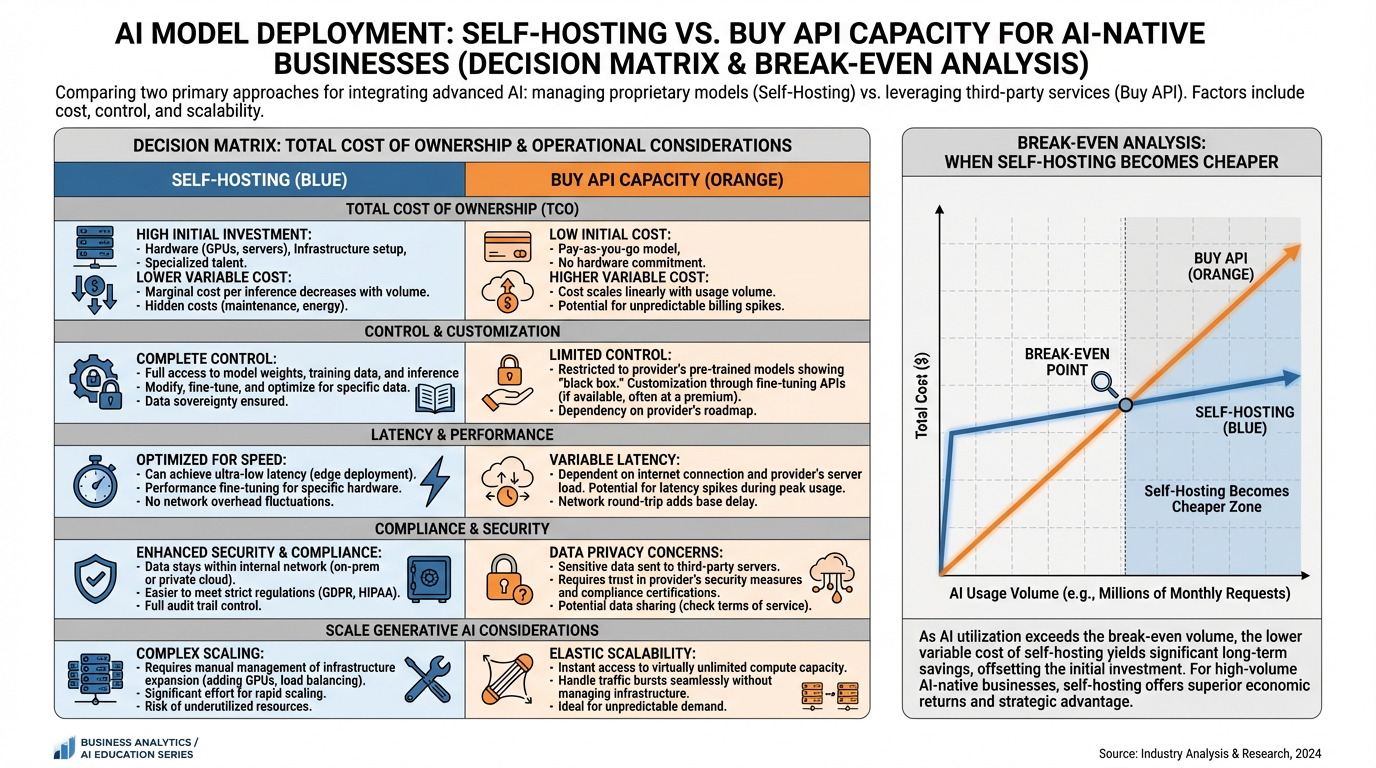
Figure 5:The self-host vs. API decision is a function of volume, compliance requirements, and margin targets — not ideology. At low to medium query volumes, buying API capacity is nearly always the economically correct choice. The break-even point depends heavily on engineering team cost.
The self-host vs. API decision is a classic build-vs-buy problem with a distinct financial signature:
Buy API capacity when:
Query volume is below ~10 million tokens per day
Engineering team is small (fewer than 5 ML engineers)
Compliance allows third-party data processing
Time-to-market is the priority
You need frontier-model quality and cannot match it with open-weight alternatives
Self-host when:
Query volume is high enough that cloud inference bills exceed the fully-loaded cost of running your own GPU cluster
Data residency or privacy compliance prohibits API usage
You need custom fine-tuning or domain adaptation that API providers do not support
Latency requirements exceed what API roundtrips can deliver
The break-even calculation: compare your monthly inference bill from the API provider against the fully-loaded monthly cost of owning or renting GPU capacity. The fully-loaded GPU cost includes hardware depreciation (or cloud GPU reservation), DevOps engineer time, model serving infrastructure, and monitoring. At most startups, this break-even is well beyond seed stage — often not reached until $5M ARR or more.
44.3 Cohort Analysis and Retention
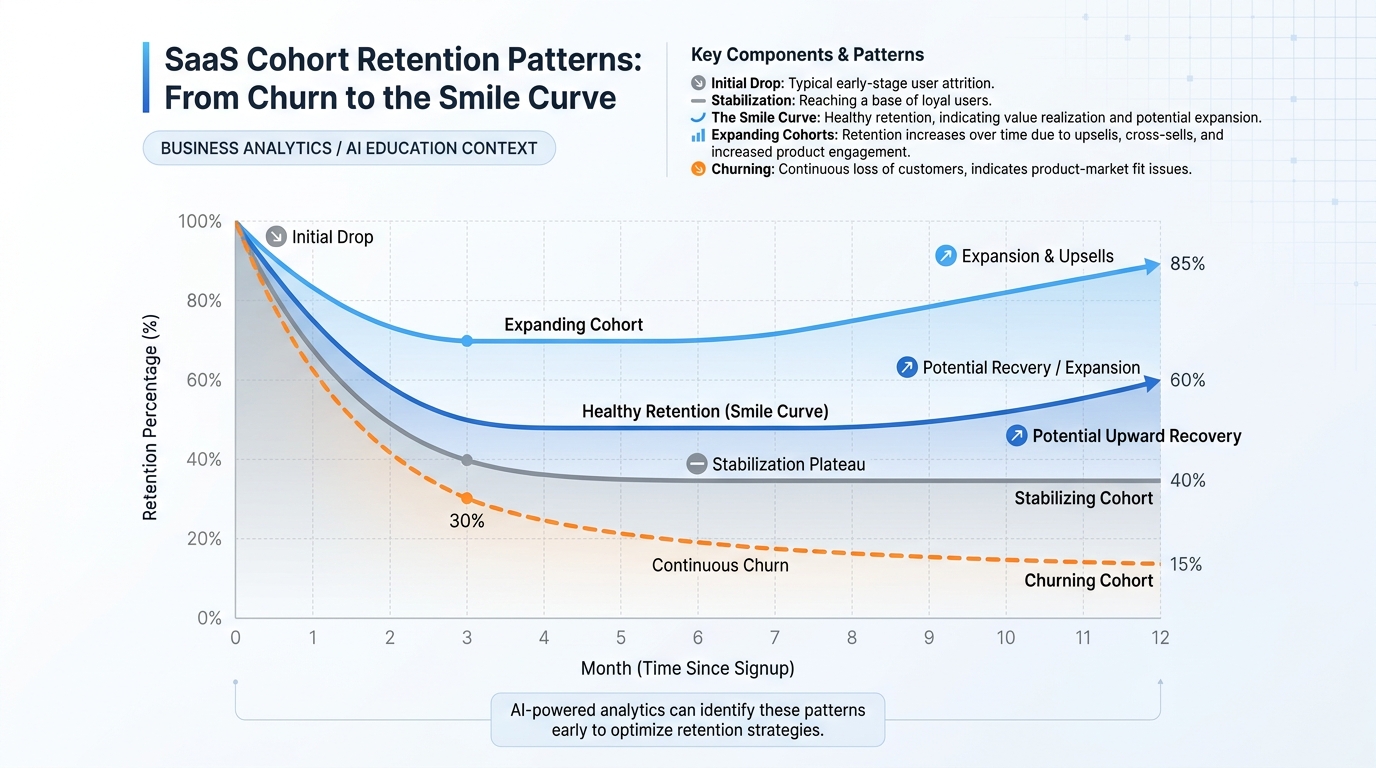
Figure 6:Cohort retention curves reveal what monthly averages hide. The “smile curve” — an initial drop followed by stabilization and eventual uptick — characterizes healthy SaaS products where high-engagement users remain after casual users churn. Flat cohorts signal that you have not achieved genuine product-market fit.
4.1Why Monthly Retention Hides the Truth
Monthly retention is the metric most founders report because it looks better than it often is. If you report “97% monthly retention,” that sounds excellent. But 97% monthly retention compounds to approximately 66% annual retention — meaning you are churning one-third of your customers every year. A company growing at 50% annually with 34% annual churn is on a treadmill.
Cohort analysis surfaces the reality. Instead of averaging all customers together, you group customers by acquisition month and track each cohort over time independently. A cohort table looks like this:
| Cohort | Month 0 | Month 1 | Month 3 | Month 6 | Month 12 |
|---|---|---|---|---|---|
| Jan | 100% | 78% | 65% | 62% | 61% |
| Feb | 100% | 81% | 70% | 67% | — |
| Mar | 100% | 75% | 68% | — | — |
The January cohort drops from 100% to 61% by Month 12 — a 39% annual logo churn. But notice that between Month 6 and Month 12, the cohort barely moved (62% → 61%). This is the “smile curve.” The customers who remain after six months are the highly engaged core who will likely stay indefinitely. Cohort curves that flatten are healthy signals. Cohort curves that continue declining through Month 12 are a signal that product-market fit has not been achieved.
4.2NRR and Its Role in Valuations
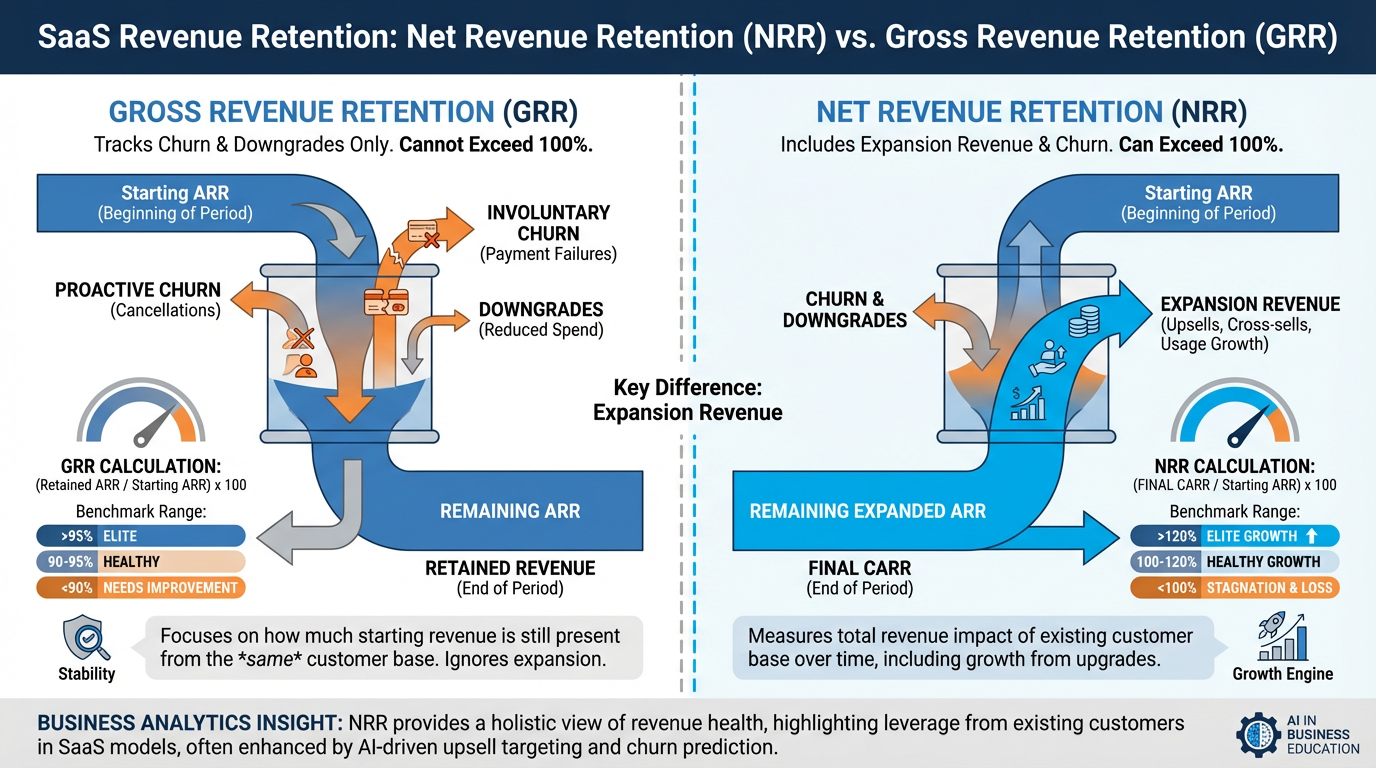
Figure 7:NRR and gross retention measure different things and tell different stories. Gross retention captures what you kept. NRR captures what you kept plus what you grew. For enterprise SaaS businesses, NRR above 120% is a signal of genuine land-and-expand motion — a fundamental valuation driver.
Net Revenue Retention (NRR), also called net dollar retention, measures the revenue retained from a cohort including expansion:
A company with NRR above 100% grows revenue even with zero new customer acquisition. This is the most powerful unit economics signal available.
NRR benchmarks:
Below 90%: Revenue is declining from existing customers. Structural problem.
90–100%: Holding pattern. Growth requires new customer acquisition.
100–110%: Healthy. Existing customers grow, partially offsetting churn.
110–130%: Strong. Land-and-expand motion working. Fundable at premium multiples.
Above 130%: Elite. Characteristic of the highest-valued SaaS companies. Snowflake famously reported NRR above 160% at IPO.
4.3Churn Diagnostic: Logo vs. Revenue
Logo churn counts the number of customers lost as a percentage of total customers.
Example: 5 customers lost from a base of 200 = 2.5% logo churn.
What it tells you: How many relationships you are losing. Important for understanding customer health and support capacity, and for signaling product-market fit problems.
What it hides: If the 5 customers lost were all on the 5,000/month, your revenue picture is very different from what logo churn suggests.
Revenue churn counts the monthly recurring revenue lost as a percentage of total MRR.
Example: The 5 customers who churned were on 19 = 50,000 MRR base = 0.19% revenue churn.
What it tells you: The actual financial impact of churn. Revenue churn is what investors use in LTV calculations and NRR metrics.
When they diverge: High logo churn + low revenue churn is typical of freemium or low-price-tier businesses with a strong enterprise segment. The metric that matters most depends on your business model. For PLG companies with a free tier, logo churn from the free base is largely meaningless; focus on revenue churn from paid cohorts.
54.4 Path to Profitability
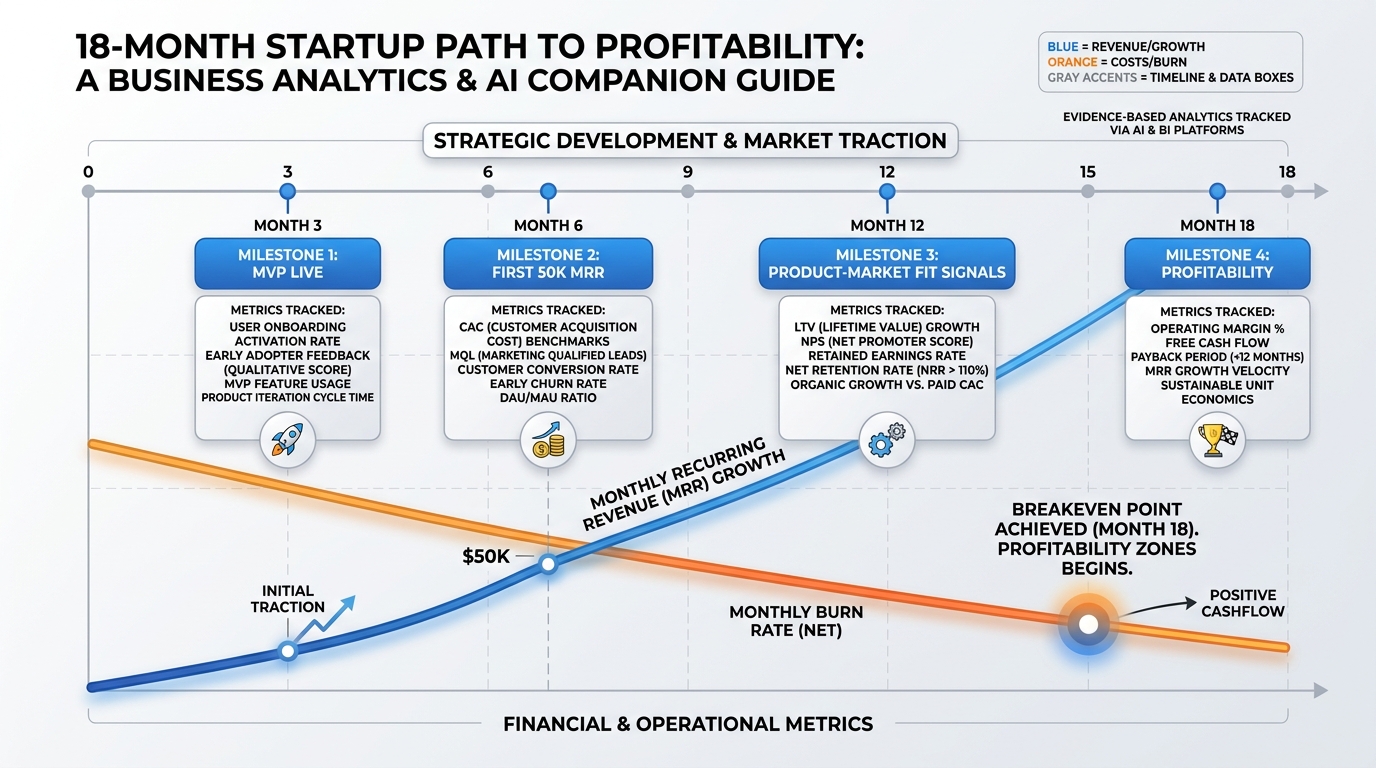
Figure 8:The 18-month path to profitability is not a projection — it is a commitment. Each milestone is falsifiable: either the MVP is live at Month 3 or it is not. Either you hit $50K MRR by Month 6 or you explain what changed and what you will do differently.
The path to profitability is not an optimistic straight line drawn through favorable assumptions. It is a sequence of falsifiable milestones, each connected to the unit economics of the chapter.
5.1The 18-Month Framework
Month 3 — MVP Live: The product exists, serves at least five paying customers, and is collecting usage data. This milestone is about reality testing more than revenue. You now have real CAC data from your first deliberate acquisition efforts, real churn data (or confirming absence of it) from your earliest customers, and real inference costs from actual usage. Your financial model should be updated immediately.
**Month 6 — First 50K MRR typically requires 50–500 customers depending on price point. Getting there proves the acquisition motion can be executed by a small team, not just by the founder. It also surfaces whether the unit economics hold at small scale: are your CAC assumptions realistic? Is gross margin compressing faster than modeled?
Month 12 — Product-Market Fit Signals: PMF is evidenced by cohort retention that stabilizes by Month 6 (smile curve visible), NRR approaching 100%, and organic referral as a measurable acquisition channel. At this point you should have at least four monthly cohorts to analyze. If retention is still declining through Month 6, PMF has not arrived.
Month 18 — Profitability or Clear Unit Economics Case for Capital: Two acceptable outcomes: (1) the business is cash-flow positive on a monthly basis, or (2) you have demonstrated sufficiently strong unit economics (LTV/CAC > 4:1, payback < 14 months, NRR > 100%, improving gross margins) to make a compelling case for growth capital that will drive you to profitability.
5.2Building the 18-Month Model
Your model needs the following inputs per month:
New customers acquired (derived from marketing spend × conversion rate)
MRR added (new customers × ARPU)
Churn (retained cohort × monthly churn rate)
Gross profit (MRR × gross margin %)
Operating expenses (headcount + infrastructure + S&M + G&A)
Net burn (gross profit minus operating expenses)
Cumulative cash position
A common mistake: founders model new customers as a fixed number each month — “we will acquire 10 customers per month” — rather than as a function of spend. The spend-based model is more defensible and more useful because it exposes the relationship between marketing investment and customer acquisition. If you are spending 3,000, you are modeling 10 new customers per month — and any investor can immediately ask: what happens to that number if you raise CAC by 50%? A spend-based model forces you to answer. A fixed-number model hides the question.
A second common mistake: modeling churn as a flat percentage applied uniformly. Real churn is highest in the first 90 days (new customer churn) and much lower after Month 6 (retained core). Flat churn models overstate early stability and understate the challenge of the critical first quarter. Use a two-rate churn model: one rate for customers in their first 90 days (often 3–8%), and a lower rate for customers past the 90-day mark (often 0.5–2%).
The model is only as good as its worst assumption. In Section 4.5 you will stress-test those assumptions systematically.
64.5 Financial Modeling with AI
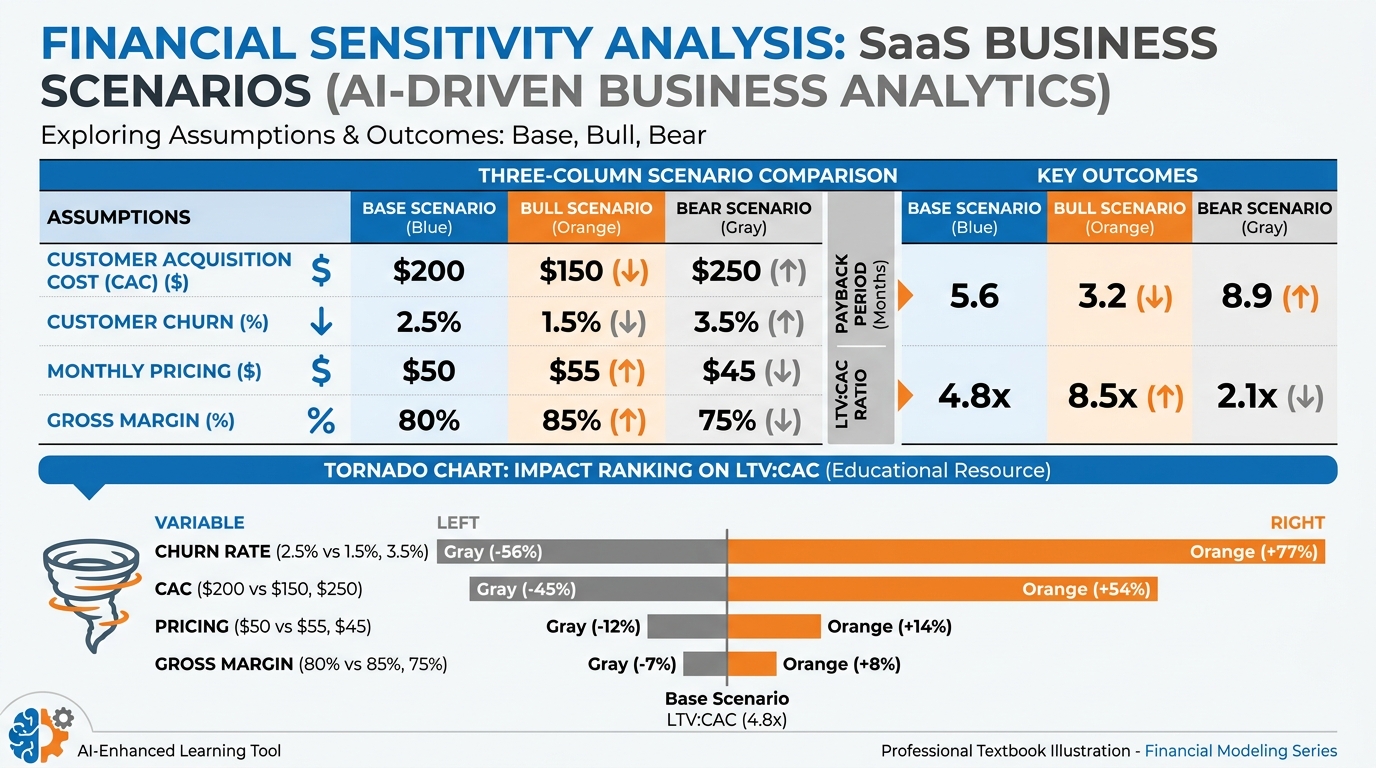
Figure 9:Sensitivity analysis answers the question most founders avoid: which single assumption, if wrong, breaks your model? The tornado chart ranks variables by their impact on payback period. In most SaaS models, churn rate and gross margin are the top two variables — not CAC or ARPU, which founders tend to obsess over.
6.1Using AI to Generate and Stress-Test Assumptions
The most valuable application of AI in financial modeling is not arithmetic — spreadsheets handle that. The value is in challenging the logic of assumptions and surfacing blind spots that founders develop when they stare at the same numbers for weeks.
An effective workflow using an AI assistant:
State your assumptions explicitly in a prompt: “Here are my business model assumptions: ARPU 3,000, average 8-month sales cycle, 3 salespeople at $120K OTE each. Calculate unit economics and identify the three assumptions most vulnerable to being wrong.”
Ask for the adversarial case: “Now assume each of these three assumptions is 50% worse than modeled. Which scenario is most catastrophic to payback period?”
Request comps: “What unit economics have publicly reported companies in vertical SaaS achieved? What is the typical range for gross margin in AI-native B2B SaaS?”
Use Code Execution for live computation: AI Studio’s Code Execution capability allows the model to run actual Python calculations — not just reason about them. This is materially different from language model arithmetic (which is unreliable) and is explored in the AI Studio Build at the end of this chapter.
6.2Scenario Modeling: Base, Bull, Bear
Every financial model should have three scenarios:
| Assumption | Bear | Base | Bull |
|---|---|---|---|
| Monthly Churn | 5% | 2% | 0.8% |
| Gross Margin | 45% | 65% | 72% |
| CAC | $5,000 | $3,000 | $1,800 |
| ARPU | $350 | $500 | $650 |
| LTV (calculated) | $3,150 | $16,250 | $59,100 |
| LTV/CAC | 0.63:1 | 5.4:1 | 32.8:1 |
| Payback (months) | 31.7 | 9.2 | 3.8 |
This table reveals something important: the bear case produces a fundamentally unbuildable business (0.63 LTV/CAC), while the bull case looks almost unrealistically good. The work of financial modeling is identifying what makes the difference — which single variable, if it moves toward the bear case, takes you from viable to unviable fastest.
In this model, the answer is churn. Moving churn from 2% to 5% collapses LTV by 80%. Moving CAC from 5,000 reduces LTV/CAC by 44%. Churn is the kill variable.
6.3Reading Financial Models Critically
When evaluating your own model — or a co-founder’s, or a potential acquisition’s — apply these stress tests:
Advanced: The 10 Questions Every Financial Model Must Answer
What is the single assumption, if wrong by 2x, that makes the business unviable?
What is the gross margin at 10x current revenue? Does it improve (scale advantage) or worsen (scale problem)?
What assumptions are borrowed from a different business model or different era? (e.g., assuming SaaS retention benchmarks apply to a consumer AI product)
Is growth modeled as a function of spend, or as an assumption? (Spend-based growth is testable; assumption-based growth is a hope.)
Does the model include fully-loaded headcount costs — not just salary, but benefits, equipment, recruiting fees, and management overhead?
What is the cash conversion cycle? How long between spending on acquisition and receiving the resulting revenue?
Are COGS separated from operating expenses? Conflating them makes gross margin invisible.
Is the model built on cohort logic or on averages? Averages mask the deterioration that cohort analysis reveals.
What happens to the model if the top two customers churn simultaneously?
When does the model predict cash-flow positive operations, and what does the company need to be true to hit that date?
7Case Study: Figma — Unit Economics That Justified the Valuation
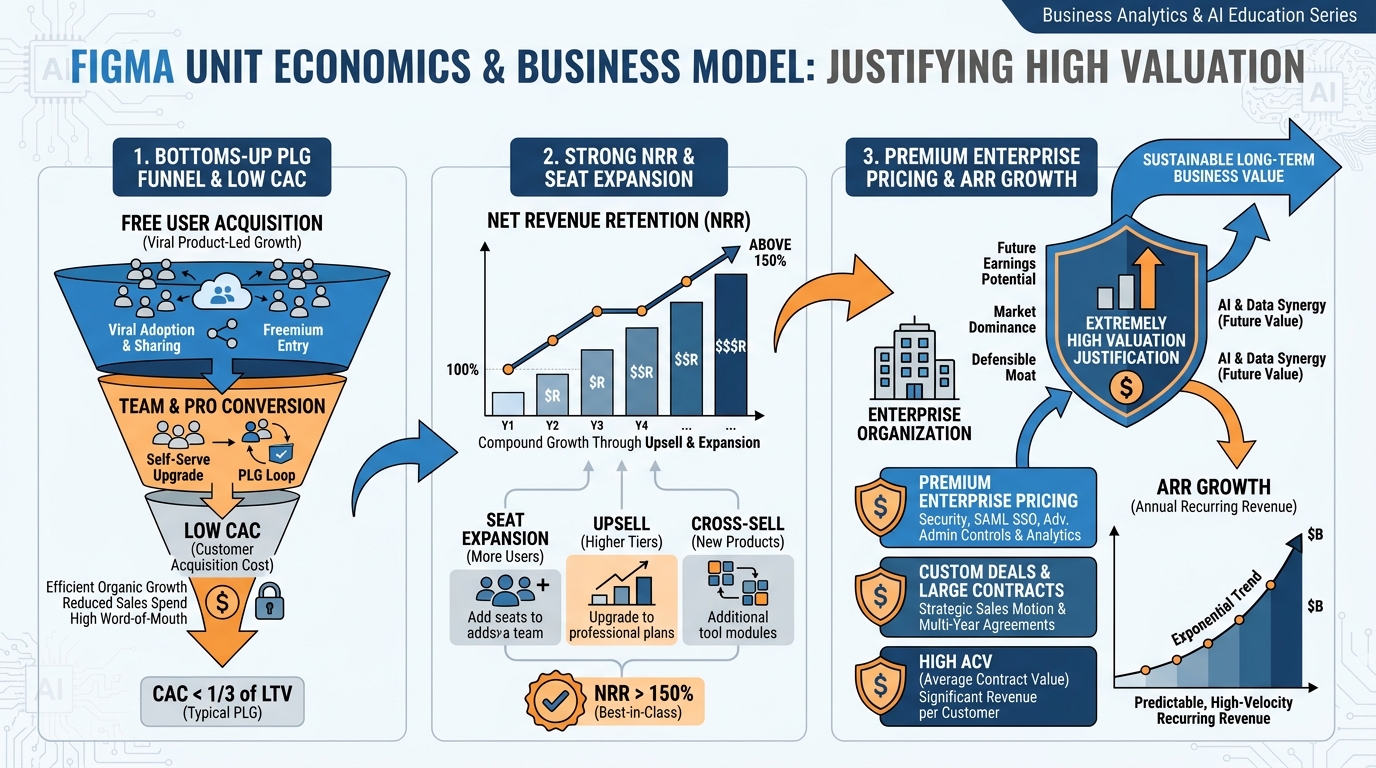
Figure 10:Figma’s unit economics were among the most compelling in enterprise SaaS history. A free-tier product that converted with near-zero marketing cost, seat-based pricing that grew automatically with team adoption, and NRR that reportedly exceeded 150% — these metrics justified a valuation that multiple precedents in design software did not.
In 2022, Adobe announced an agreement to acquire Figma for approximately 400 million. The deal was ultimately blocked by regulators in late 2023, but the valuation itself warrants analysis because it was not irrational. It reflected exceptional unit economics.
Figma’s CAC structure: Figma grew through product-led growth (PLG). Individual designers downloaded and used Figma for free. When a team adopted Figma, the initial user evangelized the product to collaborators — and the company had acquired multiple seats with near-zero incremental marketing spend. Paid CAC was suppressed to levels most enterprise SaaS companies can only dream of because the product did the selling.
Seat-based expansion mechanics: Figma charged per editor seat. As design teams grew, Figma’s revenue from each account grew automatically — not through a sales call or an upsell campaign, but through organic team expansion. This is the expansion revenue mechanism that drives elite NRR. An account that started at 4,500/year by Year 3 as the team scaled.
NRR above 150%: Figma’s reported NRR exceeded 150% — meaning existing customers were, in aggregate, paying 50% more than the previous year. For every 1.50 twelve months later from the same cohort of accounts. At this NRR, you would grow 50% annually with zero new customer acquisition.
The unit economics math: Consider an enterprise account with 20 editor seats at 900 MRR. Three years later, 80 seats at 3,600 MRR. That account generated 4x its initial revenue with acquisition cost paid once. Now multiply across thousands of enterprise accounts, with a low-cost free tier continuously seeding new enterprise relationships. The LTV/CAC ratio at the enterprise level was, by all public indicators, well above 10:1.
The valuation math: At 50x ARR, the question is not whether Figma was overpriced relative to current performance — it is whether the acquirer expected those unit economics to continue compounding. At 150% NRR, Figma’s existing ARR base would double in approximately three years without acquiring a single new customer. Combined with a PLG funnel seeding new enterprise accounts continuously, the projected terminal value of the business was substantial enough to rationalize the number. Whether the regulatory environment would have ultimately validated the deal is a separate question.
The lesson for founders: The highest-valued companies do not have the highest ARPU. They have the best expansion mechanics. When revenue from existing customers grows faster than churn, the business becomes a compounding machine. Every metric discussed in this chapter — NRR, cohort curves, revenue churn — is designed to measure whether that compound effect is present or absent.
8Lab 4: The Unit Economics Model
8.1Overview
You will build a working unit economics model for your venture — a spreadsheet that a sophisticated investor could use to evaluate your business. The model must use real or grounded assumptions, not placeholders. You will defend it live in a 10-minute Q&A.
8.2Task 1: Build the Model
Starter prompt:
“Help me build a unit economics spreadsheet for a [describe your product] that includes three pricing tiers, cohort-based retention, CAC/LTV derivation, gross margin analysis, and a month-by-month 18-month path to profitability.”
Specifications:
Three Pricing Tiers: Define a Starter, Professional, and Enterprise tier. For each tier, specify: monthly price, expected customer mix (% of total), typical use case, and whether the tier feeds expansion to higher tiers.
Cohort-Based Retention: Build a 12-month cohort table. Do not use a single average churn rate — model the first 90-day drop (new user churn) separately from the steady-state churn of engaged users. Your model should show at least three monthly cohorts tracked through Month 12.
CAC/LTV Derivation: Show blended CAC, paid CAC, and organic CAC separately. Calculate gross-margin LTV for each pricing tier. Show LTV/CAC ratio and payback period by tier.
Gross Margin Analysis: Build a COGS breakdown: hosting, inference costs, API calls, support/CS. Show gross margin at your current run rate and projected gross margin at 5x revenue (scale effects should improve it — model why).
18-Month Path to Profitability: Month-by-month table: new customers, MRR added, churn, gross profit, operating expenses (line-item), net burn, cumulative cash. Include a profitability date or capital requirement justification.
8.3Task 2: Stress Test with Three Scenarios
Build the base, bull, and bear cases from Section 4.5. For each scenario, show the resulting LTV/CAC, payback period, and Month 18 cash position. Identify which single assumption most moves payback period.
8.4Task 3: The Investor Q&A Defense
Prepare a 10-minute Q&A assuming the investor’s first question is: “Walk me through your LTV/CAC assumptions and tell me what breaks your model.”
Your answer must:
State the single most dangerous assumption in your model
Explain what evidence supports it and what would falsify it
Propose the test you will run in the next 90 days to validate or invalidate it
8.5Deliverable
A Google Sheet (shared, comment-enabled) with three tabs: (1) Assumptions, (2) Unit Economics Summary, (3) 18-Month Model. Accompanied by a one-page executive summary of what the model reveals about your business.
9AI Studio Build: The Unit Economics Stress Tester
Weekly Build: In AI Studio, enable the Code Execution tool. Build a prompt that accepts a student’s pricing, CAC, churn, and gross margin assumptions as inputs and runs sensitivity analysis — returning base, bull, and bear cases with the math shown step by step. The model must identify which single variable most affects payback period.
Why Code Execution matters here: Standard language model arithmetic is unreliable for multi-step financial calculations. When Code Execution is enabled, the AI generates and runs actual Python code — producing verifiable outputs. The difference between a model that reasons about sensitivity analysis and a model that calculates it is the difference between an opinion and an answer.
Starter prompt to expand via meta-prompting:
“You are a financial analyst. Accept the following inputs: monthly price (), monthly churn rate (%), gross margin (%). Calculate LTV, LTV/CAC ratio, and payback period for a base case. Then create bull case (all inputs 20% more favorable) and bear case (all inputs 20% less favorable). Show all math using Python code. Identify which single input variable causes the largest change in payback period when varied by 20%. Return a formatted summary table.”
Deliverable: An AI Studio share link + a written interpretation (200–300 words) of what the stress test revealed about your specific business model assumptions. Where is your model fragile? What do you need to be true?
Capability introduced: Code execution and computational grounding — using AI not just to reason but to calculate, verify, and iterate on quantitative models.
10Discussion Prompts
10.1Prompt 1: The Gross Margin Trap
The AI gross margin squeeze is a structural challenge that affects every company building products on top of third-party LLM APIs. As inference costs decline over time (driven by model efficiency and competition), some founders argue that accepting low gross margins today is a rational bet on future margin expansion. Others argue that building a business on sub-60% gross margins is a strategic error that limits access to capital and forces premature pricing decisions.
Take a position: Is the AI gross margin squeeze a temporary friction that founders should work through, or a structural signal that certain AI-native business models are fundamentally uneconomic? Ground your argument in at least two scholarly or peer-reviewed sources on technology cost curves, margin dynamics in platform businesses, or SaaS business model research published no more than two years ago.
After posting your initial response (minimum 300 words), respond substantively to at least two peers — challenge their assumptions, add a counterexample, or extend their argument with evidence from the course material or your own research. Responses of “I agree” without elaboration do not meet the standard.
10.2Prompt 2: Product-Led Growth and Unit Economics
The Figma case study illustrates how product-led growth can produce elite unit economics — specifically through near-zero paid CAC and seat-expansion driving NRR above 150%. But PLG is not a universal strategy. Many founders attempt PLG because they lack the budget for enterprise sales, not because their product has the viral and expansion mechanics required to make PLG work.
Analyze: What distinguishes a product where PLG genuinely improves unit economics from one where PLG is simply an underfunded sales motion? Apply the metrics from this chapter — CAC by channel, NRR, logo vs. revenue churn — to frame your analysis. Cite at least two scholarly or industry research sources published no more than two years ago that address PLG economics, SaaS go-to-market strategy, or pricing and packaging research.
After posting your initial response (minimum 300 words), respond substantively to at least two peers — either challenge the conditions they identify as necessary for PLG success, or offer a counterexample where PLG succeeded or failed against expectations.
11Glossary
ARPU (Average Revenue Per User): Monthly revenue divided by total paying users. Used in LTV calculations and cohort analysis.
Blended CAC: Total sales and marketing spend divided by all new customers acquired, regardless of acquisition channel.
CAC (Customer Acquisition Cost): The fully loaded cost to acquire one paying customer, including all sales and marketing expenses.
Churn Rate: The percentage of customers (logo churn) or revenue (revenue churn) lost in a given period.
Cohort Analysis: Grouping customers by acquisition period and tracking each group’s behavior independently over time. Reveals retention patterns that period averages hide.
Contraction MRR: Revenue lost from existing customers who downgrade to lower-priced plans. Distinct from churn MRR (customers who cancel).
Expansion MRR: Additional revenue generated from existing customers through upgrades, seat additions, or usage growth. The primary driver of NRR above 100%.
Gross Margin: Revenue minus cost of goods sold (COGS) divided by revenue. For AI-native businesses, COGS includes inference fees, API costs, hosting, and support.
Gross Retention: The percentage of starting MRR retained from an existing cohort, excluding expansion revenue. Always 100% or below.
Inference Cost: The variable cost of executing an LLM query — charged per token (input + output) by API providers. The defining new COGS line for AI-native products.
LTV (Lifetime Value): The gross profit generated by a customer over their entire relationship with the company. Always use the gross-margin version, not the revenue version.
LTV/CAC Ratio: LTV divided by CAC. The primary indicator of unit economics health. 3:1 is the institutional floor; 5:1–12:1 is the target range for AI-native SaaS.
Logo Churn: The number of customer accounts lost as a percentage of total accounts. Can diverge significantly from revenue churn when account sizes vary.
Net Revenue Retention (NRR): MRR retained from a cohort including expansion revenue, expressed as a percentage of starting MRR. Above 100% means the cohort grows without new acquisition.
Organic CAC: The cost to acquire customers through non-paid channels — content, SEO, word-of-mouth, community. Never zero because creating organic content requires time and people.
Paid CAC: The cost to acquire customers exclusively through paid channels. Typically higher than blended CAC in companies with strong organic programs.
Payback Period: The number of months required to recover CAC from gross profit generated by the customer. 12 months is the institutional cutoff for institutional funding consideration.
Product-Led Growth (PLG): A go-to-market strategy where the product itself drives acquisition, conversion, and expansion — reducing reliance on outbound sales.
Revenue Churn: MRR lost from churning customers as a percentage of total MRR. A more accurate financial health indicator than logo churn for companies with varied account sizes.
Self-Hosting: Running AI models on owned or rented GPU infrastructure rather than purchasing inference from an API provider. Economically justified at high query volumes and strict data compliance requirements.
Smile Curve: The cohort retention pattern where an initial drop stabilizes and potentially recovers as low-engagement users churn early, leaving a retained core of high-engagement customers.
Unit Economics: Analysis of revenue and costs at the level of a single customer. The fundamental test of whether a business model generates more value than it consumes.
12Readings
Skok, D. (n.d.). SaaS Metrics 2.0 — A guide to measuring and improving what matters. For Entrepreneurs. https://
www .forentrepreneurs .com /saas -metrics -2/ Andreessen Horowitz. (n.d.). 16 metrics for SaaS companies. a16z. https://
a16z .com /16 -metrics/ Bessemer Venture Partners. (n.d.). State of the Cloud (most recent edition). https://
www .bvp .com /atlas /state -of -the -cloud Paddle / ProfitWell. (n.d.). The ultimate guide to SaaS churn. https://
www .paddle .com /resources /saas -churn Lenny Rachitsky. (n.d.). What is good retention? Lenny’s Newsletter. https://
www .lennysnewsletter .com /p /what -is -good -retention -benchmarks OpenAI, Anthropic, Google DeepMind. (n.d.). Model pricing pages (current). Review for latest inference cost benchmarks.