Reporting & Analytics: The Numbers That Actually Run Your Business
Data is not a report. Data is a decision waiting to happen.
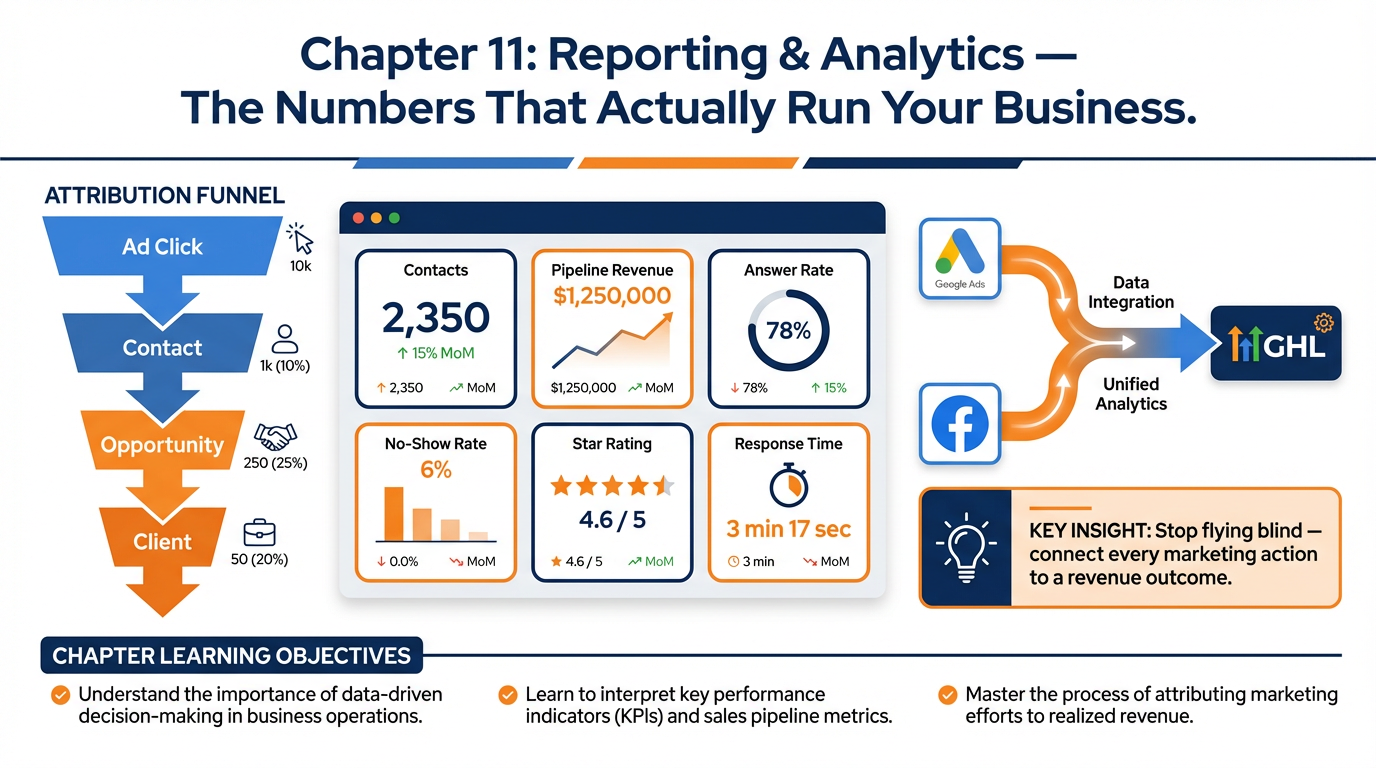
Figure 1:Chapter 11 overview: from attribution reports to custom client dashboards — GHL’s reporting suite turns raw activity data into the decisions that make marketing spend more efficient and operations more reliable.
111.1 The Business That Runs on Gut Feeling
Marcus owns a med spa. He spends 2,500 on Google Ads, and posts daily on Instagram. He runs email campaigns, SMS sequences, and a podcast. His business is growing. He knows because revenue is up.
What he does not know — cannot tell you with any precision — is which of these activities produced the growth. He cannot tell you which campaign brought in the three highest-lifetime-value clients this quarter. He cannot tell you whether the Instagram posts contribute anything at all to booked appointments, or whether he could eliminate them entirely and see no impact. He cannot tell you which ad creative generated his lowest cost-per-acquisition or which landing page converts cold traffic best.
He is flying the plane by looking out the window. The altimeter works, but he has disconnected every other instrument.
The gut-feeling business is surprisingly common, even among operators who would describe themselves as data-driven. They track revenue. They watch follower counts. They check open rates. But they cannot connect any of those numbers to a decision about where to invest the next dollar or what to cut next quarter.
GHL’s reporting and analytics module is the instrument panel Marcus needs. It connects every marketing activity — every ad click, every form submission, every call answered and missed, every appointment booked and no-showed, every conversation opened and closed — to the contact record that generated it. Attribution becomes answerable. Decisions become supportable. And the business stops running on faith.
This chapter builds that instrument panel for your business.
211.2 The GHL Reporting Suite: What’s Available and Where to Find It
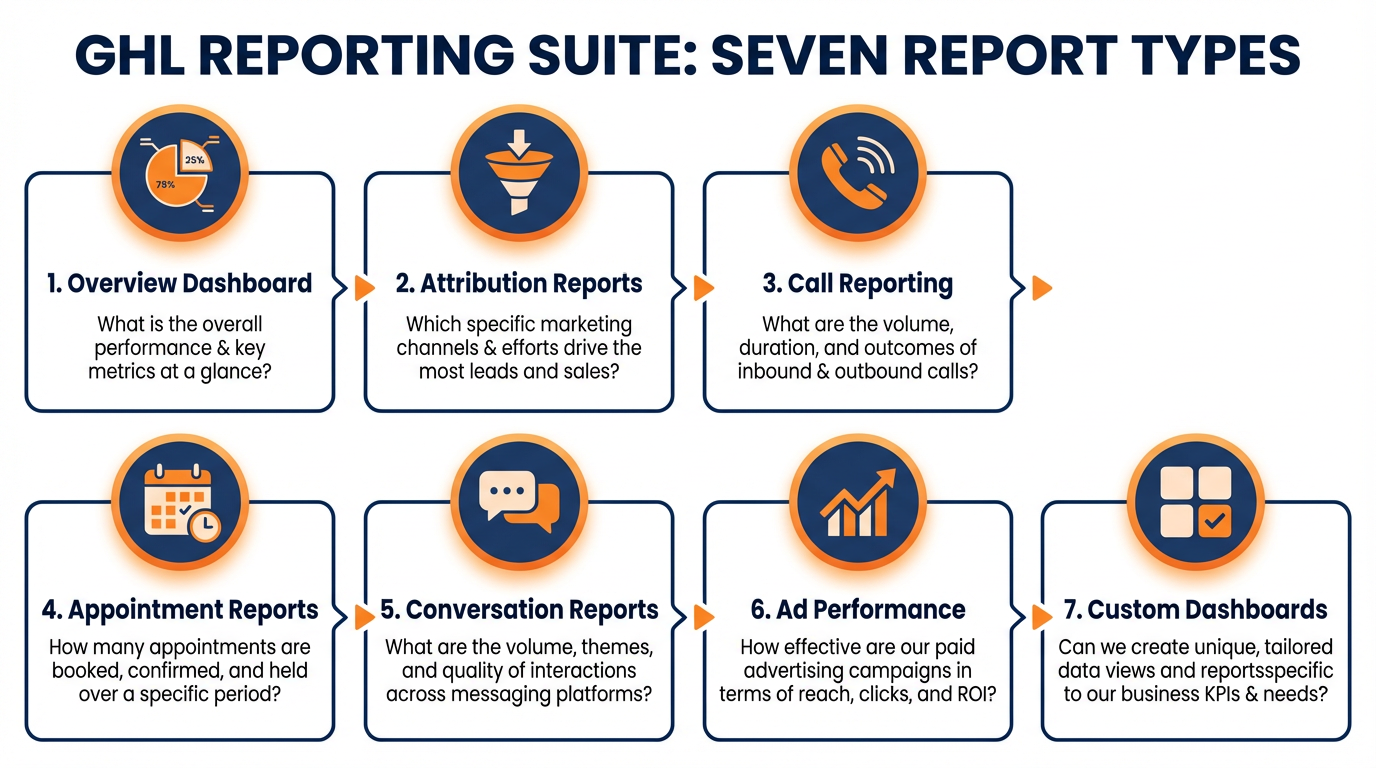
Figure 2:The GHL Reporting Suite: seven report types covering contacts, attribution, calls, appointments, conversations, ad performance, and custom dashboards — each answering a different operational question.
Navigate to Reporting in your GHL left sidebar. The Reporting module contains seven distinct report types, each answering different operational questions.
2.1Overview Dashboard
The default landing page of the Reporting module. Shows a configurable summary of key metrics across all report types — new contacts added, pipeline revenue, calls handled, appointments booked, and campaign performance. Think of it as the executive summary of your business’s last 30 days.
2.2Attribution Reports
The most strategically important report in the suite. Attribution reports answer the question: “Where did our contacts come from, and which sources are producing the best outcomes?” There are two attribution models:
First Attribution: Gives full credit to the first touchpoint that brought a contact into the system — the first ad click, the first organic search visit, the first referral. Useful for understanding what initially attracts leads.
Last Attribution: Gives full credit to the most recent marketing touchpoint before conversion. Useful for understanding what closes leads.
2.3Call Reporting
Detailed analytics on all phone activity — inbound, outbound, answered, missed, duration, recording access, and call outcome categorization. Filterable by date range, phone number, assigned user, and call direction.
2.4Appointment Reports
Analytics on the scheduling funnel — appointments booked, confirmed, attended, cancelled, and no-showed. Broken down by calendar, service type, and assigned team member. Shows no-show rate and cancellation rate over time.
2.5Conversation Reports
Metrics on the unified inbox — total conversations opened, average first response time, resolution time, conversations by channel, and agent performance. The primary dashboard for customer communication health.
2.6Google Ads Reporting
When a Google Ads account is connected, GHL pulls campaign performance data — impressions, clicks, conversions, cost-per-click, and cost-per-acquisition — alongside the contact-level attribution data. Correlates ad spend directly to leads in the CRM.
2.7Facebook Ads Reporting
Same structure as Google Ads reporting, but for connected Meta Ads accounts. Shows campaign, ad set, and ad-level performance alongside CRM attribution data.
311.3 Understanding Attribution: First Touch, Last Touch, and Why It Matters
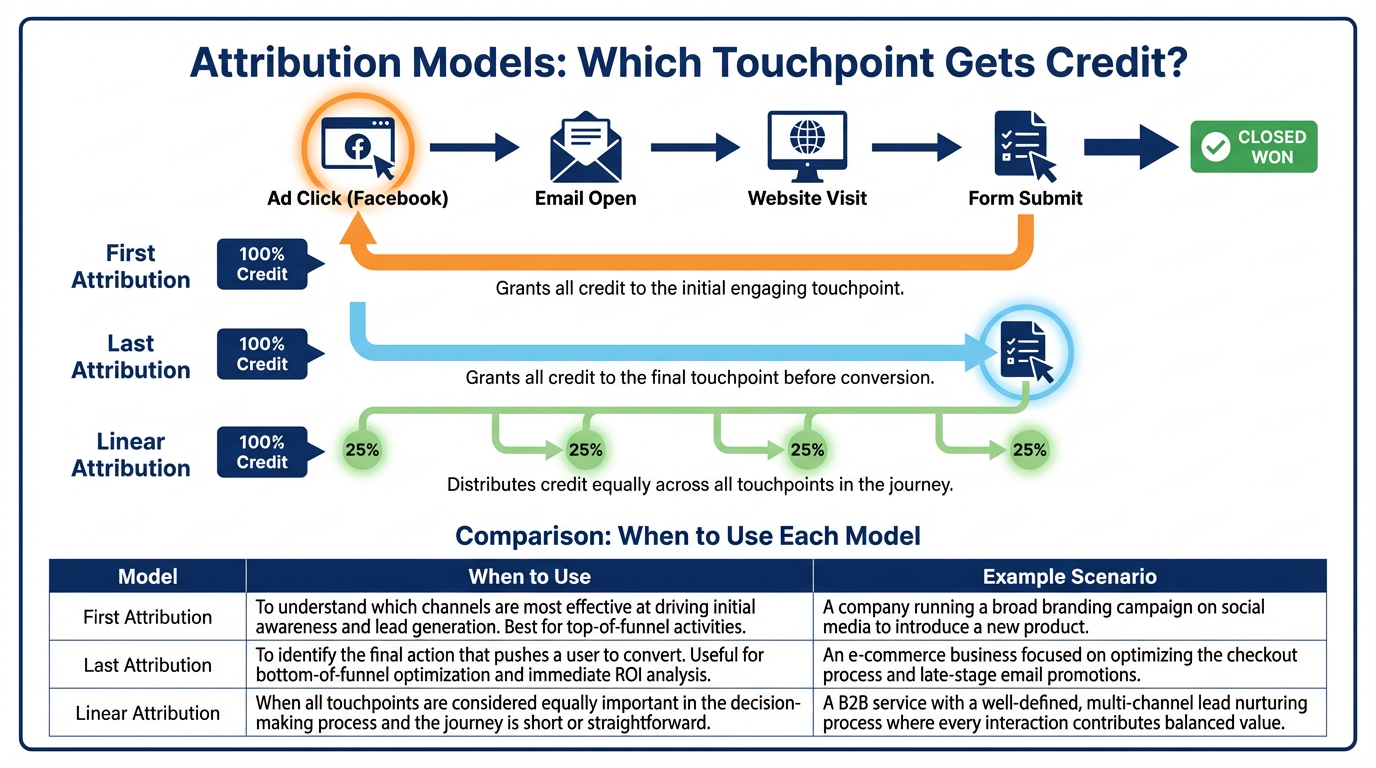
Figure 3:Attribution models: the same customer journey assigns credit differently depending on the model used. Most businesses should start with Last Attribution (what closes deals?) before adding First Attribution (what attracts leads?).
Attribution is the most misunderstood concept in marketing analytics. It is also the one that most directly determines how you allocate budget — which makes getting it right worth the effort.
3.1First Attribution in Practice
Imagine a lead who follows this path: clicks a Facebook ad → visits your landing page → doesn’t opt in → searches Google for your business a week later → finds your organic listing → opts in → books a consultation → purchases.
First attribution credits: Facebook ad. Last attribution credits: Google organic search.
Neither is wrong. They answer different questions.
First attribution tells you what is best at starting customer relationships. If Facebook consistently shows high first-attribution counts but low last-attribution, it means Facebook is excellent at introducing your brand but something is happening in the middle of the journey that causes people to come back through a different channel to convert.
Last attribution tells you what is best at closing. If Google organic search consistently shows high last-attribution counts, it means people who are serious enough to convert are searching for you directly — which suggests your brand awareness and direct demand are strong.
3.2How GHL Tracks Attribution
GHL uses a combination of first-party cookies and UTM parameters to track the contact’s journey from first touchpoint to conversion. When a new contact arrives at a funnel page, GHL records:
Source: Where they came from (paid search, organic, direct, social, referral)
Medium: The channel type (cpc, organic, email, sms)
Campaign: The specific campaign name (from your UTM parameters)
Content: The specific ad or creative variant (from utm_content)
Term: The keyword that triggered the ad (for search campaigns)
These fields populate the First Attribution and Last Attribution custom fields on the Contact record automatically, without any manual input. Review them by opening any contact record and scrolling to the Attribution section.
411.4 Connecting Google and Facebook Ads Accounts

Figure 4:Facebook Conversions API (CAPI) vs. browser pixel: server-side conversion tracking bypasses iOS privacy restrictions and ad blockers, delivering near-complete conversion data to Facebook’s attribution model.
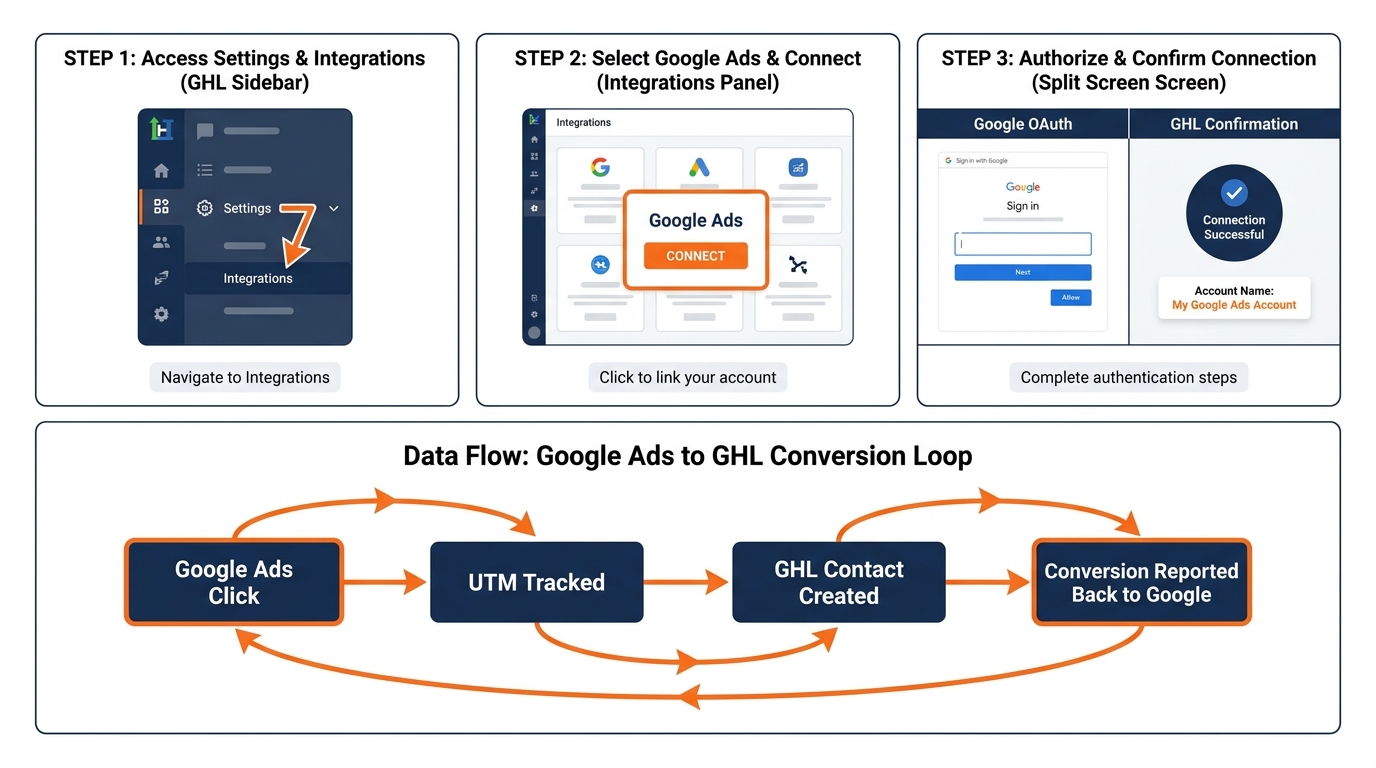
Figure 5:Google Ads connection: three steps to link your ad account, plus the data flow showing how GHL contact creations and pipeline events report back to Google as conversion signals.
Ad reporting in GHL requires connecting your ad accounts. This connection gives you campaign-level performance data inside GHL, alongside the contact-level attribution data from your CRM — creating a complete picture from ad impression to closed revenue.
4.1Connecting Google Ads
Navigate to Settings → Integrations → Google Ads.
Click Connect Google Ads Account. Authorize via your Google account. Select the specific Google Ads account you want to connect (if you manage multiple accounts, connect each separately).
Once connected, GHL begins importing:
Campaign names, ad group names, keyword performance
Impressions, clicks, CTR
Conversions tracked through Google Ads conversion tracking
Cost data (spend, CPC, CPL, CPA)
GHL also enables Conversion Import — sending contact creation and pipeline stage events back to Google Ads as conversion signals. This is the link that allows Google’s smart bidding algorithms to optimize for leads that actually convert to revenue, not just form submissions.
To enable conversion import: Settings → Integrations → Google Ads → Conversion Actions → + Add Conversion. Map your key GHL events (Contact Created, Opportunity Won) to Google Ads conversion events.
4.2Connecting Facebook Ads
Navigate to Settings → Integrations → Facebook Ads.
Click Connect Facebook Account and authorize via the Facebook account that manages your Ads Manager. Select the ad account to connect.
GHL imports:
Campaign, ad set, and ad-level performance data
Reach, impressions, clicks, CTR, CPM
Facebook-reported conversions (from pixel events)
Cost data (spend, CPC, CPM, CPA)
Additionally, GHL integrates with Facebook Conversions API (CAPI) — a server-to-server connection that sends conversion events directly from GHL to Facebook without relying on browser-based pixel tracking. CAPI dramatically improves conversion tracking accuracy in a privacy-restricted browser environment. Enable it in Settings → Integrations → Facebook → Conversions API → Enable.
511.5 Call Reporting: The Revenue Data Nobody Talks About
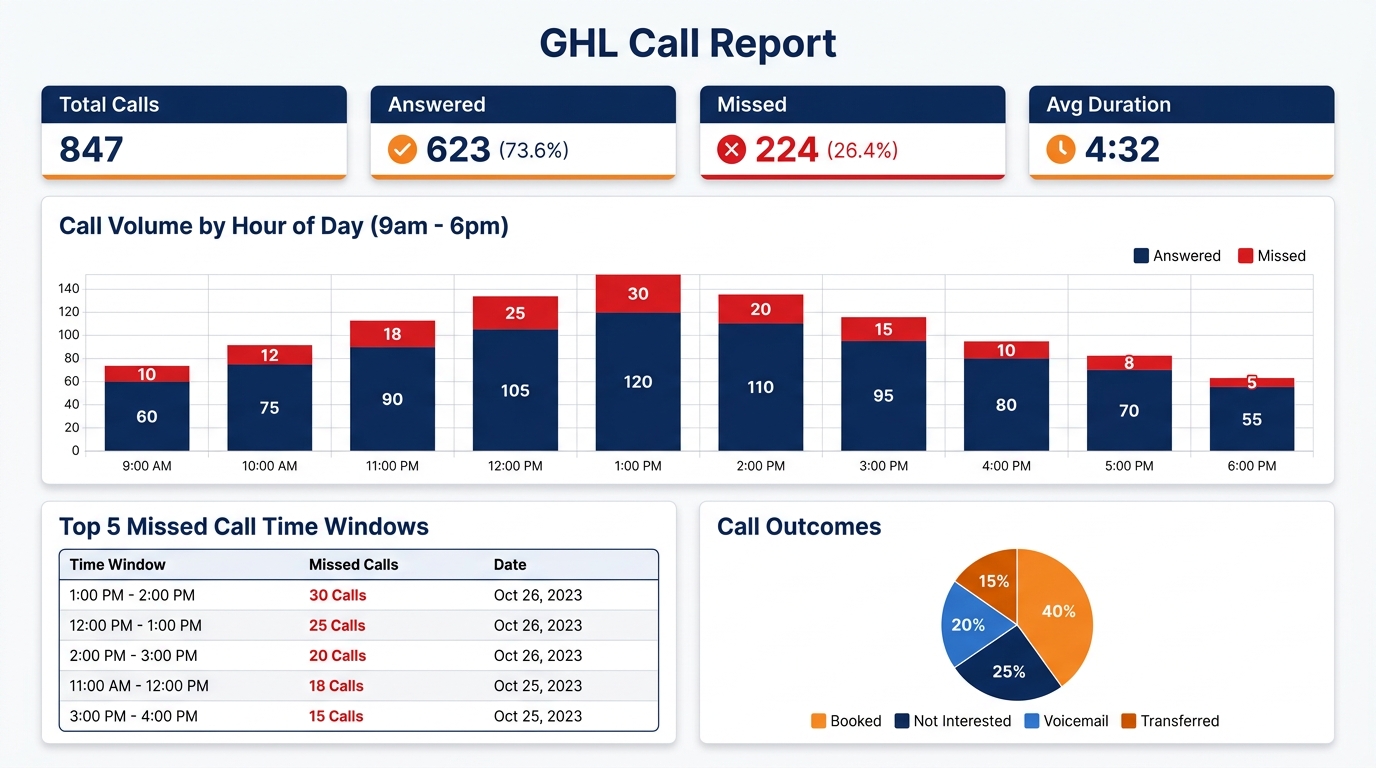
Figure 6:Call Performance dashboard: four headline metrics, hour-by-hour call volume distribution, and a table of peak missed-call windows — the data needed to staff phones correctly or deploy Voice AI strategically.
For businesses where phone is a primary conversion channel — home services, healthcare, legal, financial, real estate — call reporting is arguably more valuable than any digital marketing report.
5.1Accessing Call Reporting
Navigate to Reporting → Call Reporting. Filter by:
Date range (today, this week, last 30 days, custom)
Phone number (specific line, all lines)
Direction (inbound, outbound, all)
User (calls handled by a specific team member)
Outcome (answered, missed, voicemail)
5.2What to Read in Your Call Report
Answer Rate: The percentage of inbound calls answered by a human (or AI agent). If your answer rate is below 85% during business hours, you are losing a material percentage of high-intent inbound leads to competitors with faster response times.
Missed Call Count: Raw number of unanswered inbound calls. Cross-reference this with your Missed Call Text-Back workflow execution log (Chapter 4). Are 100% of missed calls receiving the text-back? Any gap between missed calls and text-back sends represents silent lead loss.
Average Call Duration: A proxy for conversation quality. Very short calls (under 60 seconds) may indicate the caller hung up before reaching the right person or information. Very long calls (over 20 minutes for a single inbound inquiry) may indicate a friction point in the intake conversation.
Call Recording Access: Every call on your GHL number is recorded (with appropriate legal disclosures — Chapter 5). From the Call Report, click any call record to access the recording. Use this for quality coaching, training new team members, or understanding what objections are being raised most frequently.
5.3Call Reporting for Coaching and QA
Monthly, pull the call recordings for your team’s ten most recent booked appointments and ten most recent calls that did not convert. Listen to both sets. The patterns in each set will tell you more about what your best closers do differently than any sales training program. Build a scoring rubric from what you hear. Apply it consistently.
611.6 Appointment Reports: The Scheduling Funnel
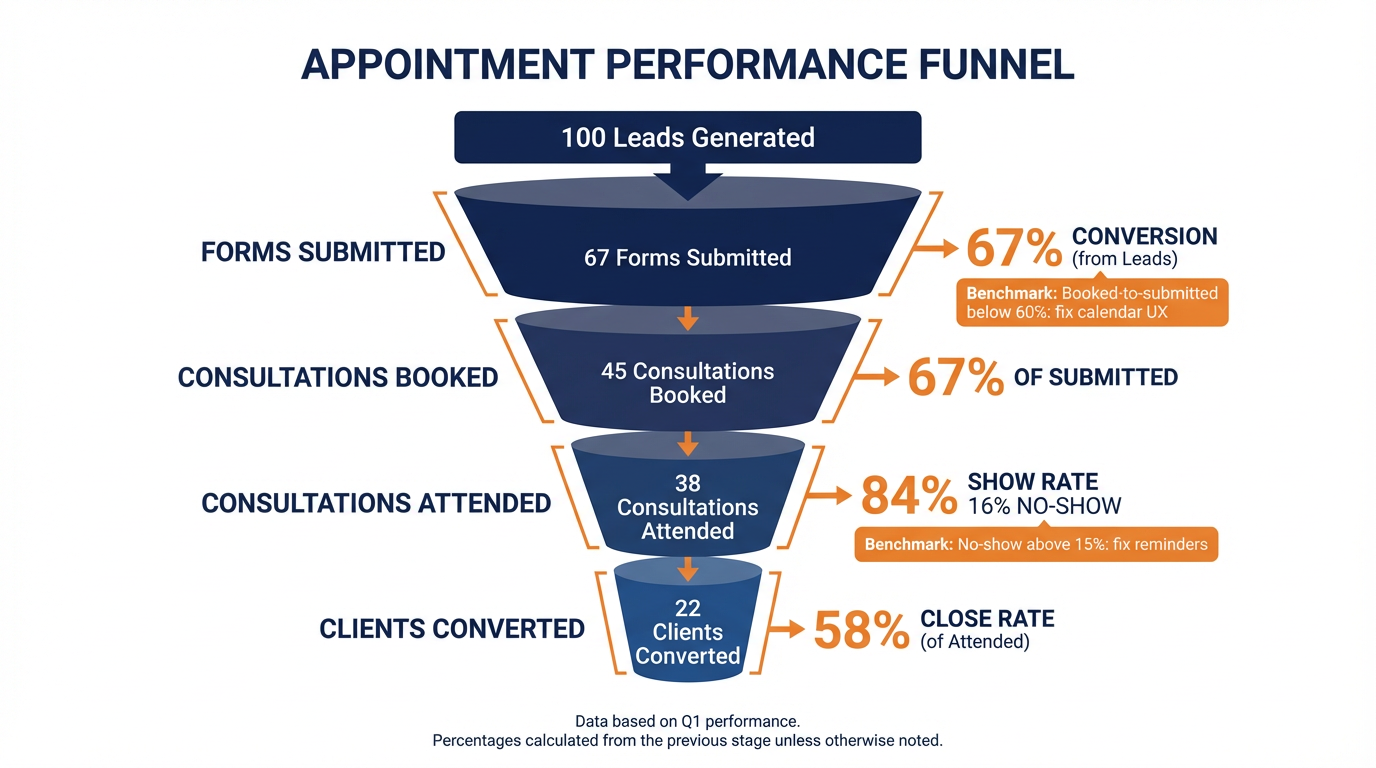
Figure 7:The appointment performance funnel: each stage has a benchmark conversion rate. A no-show rate above 15% signals a reminder sequence problem; a booked-to-submitted rate below 60% signals a calendar UX problem.
GHL’s Appointment Report shows the full scheduling funnel — from booking to attendance — broken down by calendar, service type, and assigned team member.
6.1Key Appointment Metrics
Booking Rate: Total appointments booked in a period. Trend lines show whether your funnel and AI booking improvements (Chapters 7 and 9) are generating more scheduled meetings.
Cancellation Rate: Percentage of booked appointments that were cancelled before attending. Benchmark: under 15% is healthy; above 25% suggests either qualification issues (wrong people booking) or insufficient commitment during the booking process.
No-Show Rate: Percentage of confirmed appointments where the contact did not attend and did not cancel. The most expensive metric in any appointment-based business — a no-show is a blocked calendar slot with zero revenue. Benchmark: under 10% is healthy; over 20% indicates a reminder sequence problem (Chapter 7) or a commitment issue in the booking flow.
Attendance Rate: The inverse of cancellation and no-show — the percentage of booked appointments that actually happened. Your workflows, reminder sequences, and appointment confirmation processes live or die by this number.
Team Member Performance: Appointment reports break down booking, cancellation, and no-show rates by assigned team member. If one team member has a 35% no-show rate while others are at 8%, the issue may be specific to how that member presents the appointment value or follows up on confirmations.
6.2Building an Appointment Report Dashboard Widget
In Reporting → Dashboards → + New Widget, add an Appointment Summary widget showing:
This month’s bookings vs. last month (trend)
This month’s no-show rate vs. last month
Cancellation rate by calendar
Review this dashboard weekly. A rising no-show rate is the earliest warning signal that your reminder workflows need attention — before the revenue impact becomes visible in your pipeline.
711.7 Custom Dashboards: Your Business on One Screen
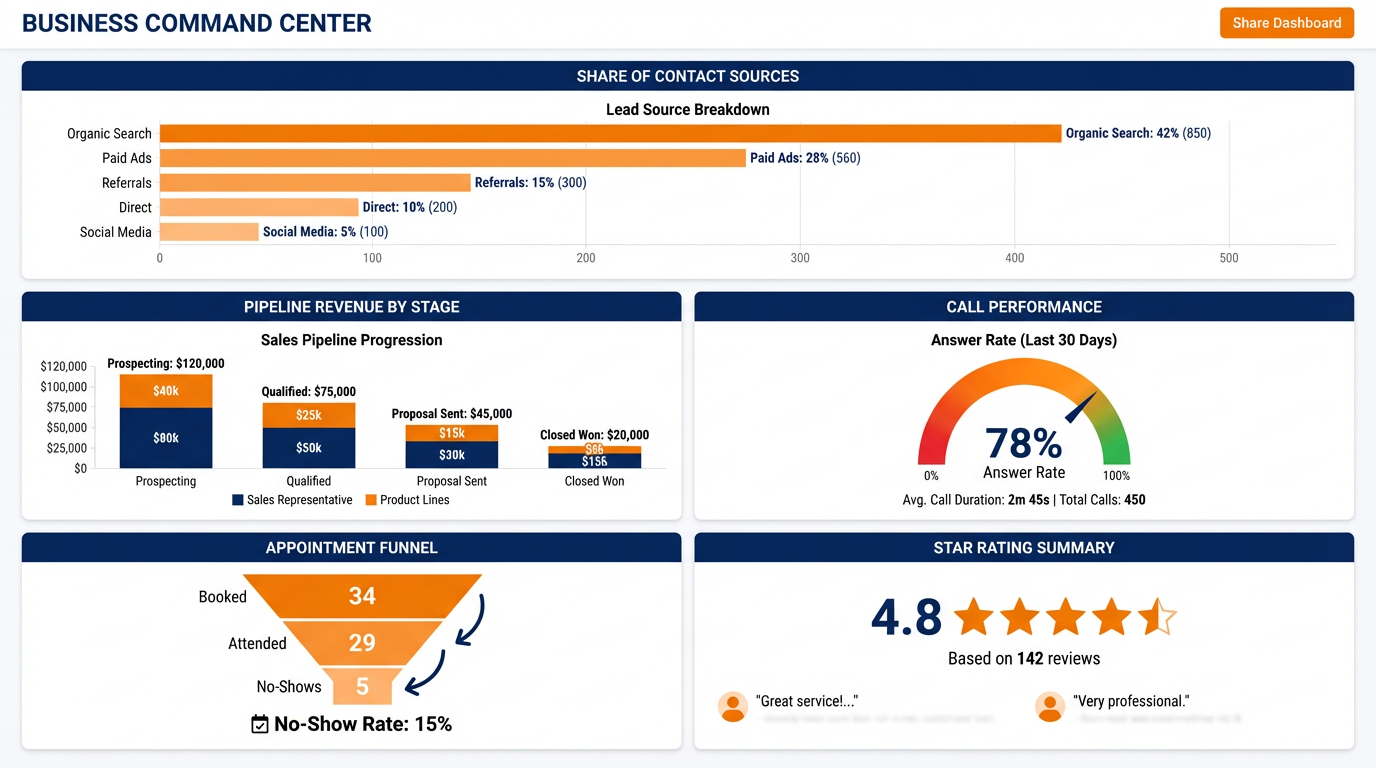
Figure 8:The Business Command Center dashboard: six widgets, one screen, 90-second morning review. Every number has a decision attached to it.
GHL’s custom dashboard builder allows you to assemble any combination of report widgets into a single, configurable view — then share that view with team members or clients via a read-only link.
7.1Building a Custom Dashboard
Navigate to Reporting → Dashboards → + New Dashboard.
Name the dashboard (e.g., “Marketing Performance — Monthly,” “Sales Team Ops,” or “Client Dashboard — [Client Name]”).
Click + Add Widget. Available widget types include:
Pipeline Value: Total value of opportunities in each stage
Conversion Rate: Lead-to-opportunity or opportunity-to-close rates
Call Summary: Answered, missed, outbound call counts
Appointment Summary: Bookings, no-shows, attendance rates
Attribution Chart: Contacts by first or last attribution source
Review Summary: Star rating, review count, response rate
Custom Metric: Any custom field or tag count, with threshold alerts
Arrange widgets by drag-and-drop. Resize each widget. Set the default date range for each widget independently if needed.
7.2Sharing Dashboards With Clients (Agency Use)
Navigate to your custom dashboard → Share → Get Read-Only Link. Copy the link. Share it with your client.
The client accesses a live, real-time view of their account’s key metrics without needing a GHL login. The link auto-refreshes — every time they open it, they see current data. For agencies, this replaces monthly PDF reporting with permanent, live transparency.
What to include on a client-facing dashboard:
New leads this month (with source breakdown)
Appointments booked and attended
Calls answered vs. missed
Pipeline value by stage
Review count and current star rating
What to exclude from client dashboards: internal team performance breakdowns, workflow execution logs, cost-per-lead data that might invite scope renegotiation, and any data that could be confusing without context.
811.8 Lab 11: Build Your Business Command Center Dashboard
A business running on gut feelings and monthly PDF reports is flying blind. The businesses that grow fastest have one thing in common: they look at the same five numbers every single morning and make decisions based on what those numbers say. In this lab, you build a custom GHL reporting dashboard that shows your five most important business metrics at a glance — updated in real time — and generates a shareable link for your team or clients. By the end, you have a daily morning ritual dashboard you can check in 90 seconds and know exactly where your business stands.
8.1Step 1: Navigate to the Reporting Dashboard Builder
In the left sidebar, click Reporting.
You land on the default Overview Dashboard. To create your custom dashboard:
Click the Dashboards dropdown (or tab) at the top of the Reporting section
Click + New Dashboard
Enter the dashboard name:
Business Command Center — [Your Business Name]Click Create Dashboard.
The dashboard builder opens with an empty canvas.
You’ll know you did this right when: A blank dashboard canvas appears with a “+ Add Widget” button in the upper right or center of the canvas.
8.2Step 2: Add Widget 1 — Contact Acquisition (Where Are My Leads Coming From?)
Click + Add Widget.
Browse the widget library → select Contact Summary (or “Contacts” widget).
Configure:
Metric: New Contacts Added
Date Range: Last 30 Days
Group By / Breakdown: First Attribution Source
Click Apply or Save Widget.
On the canvas, drag the widget to the top-left position → resize to full-width by dragging its corner.
You’ll know you did this right when: The Contact Acquisition widget shows a bar chart or list of lead sources with contact counts for the last 30 days.
8.3Step 3: Add Widget 2 — Pipeline Revenue (How Much Money Is In Progress?)
+ Add Widget → select Pipeline Value or Opportunities Summary.
Configure:
Pipeline: Your primary Sales pipeline
View: Value by Stage (shows dollar amount in each stage)
Date Range: Current Period (or All Time, depending on your GHL version)
Save the widget → drag to the top-right position on the canvas.
You’ll know you did this right when: The Pipeline widget shows each pipeline stage with the total dollar value of opportunities in that stage. If values show $0, verify that your opportunities have dollar values entered.
8.4Step 4: Add Widget 3 — Call Performance (Are We Capturing Every Lead?)
+ Add Widget → select Call Summary or Phone / Call Performance.
Configure:
Metrics: Inbound Calls Answered, Inbound Calls Missed, Answer Rate (%)
Date Range: Last 30 Days
Filter: All phone numbers (or select specific number)
Save → drag to the middle-left position.
You’ll know you did this right when: The widget shows three distinct metrics: total inbound calls, answered calls, and missed calls, with an answer rate percentage.
8.5Step 5: Add Widget 4 — Appointment Funnel (Are Booked Appointments Actually Happening?)
+ Add Widget → select Appointment Summary or Appointments.
Configure:
Metrics: Appointments Booked, Attended, No-Show Rate (%)
Date Range: Last 30 Days
Calendar: Your primary consultation calendar
Save → drag to the middle-right position.
You’ll know you did this right when: The widget shows booked appointments alongside attended appointments and a no-show rate percentage.
8.6Step 6: Add Widget 5 — Reputation (How Do We Look Today?)
+ Add Widget → select Review Summary or Reputation.
Configure:
Metrics: Average Star Rating, Total Reviews, Reviews This Month
Platform: Google (select from dropdown)
Save → drag to the bottom of the dashboard.
You’ll know you did this right when: The widget shows your current Google star rating (e.g., 4.8 ★), total review count, and reviews added this month.
8.7Step 7: Add Widget 6 — Conversation Response Time (How Fast Is Your Team Responding?)
+ Add Widget → select Conversation Summary or Inbox Activity.
Configure:
Metric: Average First Response Time
Date Range: Last 30 Days
Save → add to the dashboard.
8.8Step 8: Arrange, Save, and Generate the Share Link
Rearrange widgets by dragging them into your preferred layout:
Top row: Contact Acquisition (full width)
Second row: Pipeline Revenue (left) + Call Performance (right)
Third row: Appointment Funnel (left) + Reputation (right)
Bottom: Conversation Response Time
Click Save Dashboard (or it auto-saves — confirm by looking for a save confirmation).
Click Share (or the share icon, usually at the top of the dashboard) → Get Read-Only Link.
Copy the link.
Bookmark the link in your browser for daily use.
Share the link with your team members who need visibility into these metrics.
You’ll know you did this right when: The shared link opens the dashboard in a browser without requiring a GHL login — it’s read-only and can be bookmarked or shared without exposing account access.
8.9Step 9: Run the Morning Dashboard Ritual
This 90-second ritual replaces every “how are we doing?” conversation with actual data:
Every morning, open your dashboard and check:
Contact Acquisition: Did we add leads yesterday? Are sources performing as expected?
Pipeline Revenue: Any stuck deals (no movement in 7+ days)?
Call Performance: Was yesterday’s answer rate above 80%? If below, why?
Appointment Funnel: Is the no-show rate above 15%? If yes, reminder workflow needs attention.
Reputation: Did any new reviews come in? Do any need a response?
If a number surprises you, drill down. If everything looks normal, move on. The ritual takes 90 seconds when the dashboard is built correctly.
You’ll know you did this right when: You can describe what each widget shows and name one actionable decision each widget informs for your business.
Troubleshooting Common Issues
Widgets show zero values even though I have data in my account: Check the date range setting on each widget. A widget set to “Today” will show zero if no activity occurred today. Change to “Last 30 Days” or “All Time” to verify data exists. Also confirm the filters match your actual data — a Pipeline widget filtered to a pipeline with no opportunities shows zero.
“+ Add Widget” doesn’t show the widget types I expect: The widget library varies by GHL plan tier. Some advanced widget types (Attribution breakdown, Conversation analytics) require higher-tier plans. If a specific widget type isn’t available, use the closest available alternative.
I can’t find “Get Read-Only Link” or “Share Dashboard”: The share feature may appear as a share icon (person with + symbol) in the dashboard header. If not visible, check that you’re viewing the custom dashboard you created (not the default Overview Dashboard) — the default dashboard may not have sharing enabled.
The share link requires a GHL login: Read-only dashboard links should work without login. If the link redirects to a login page, the dashboard may be set to “Private.” Check the dashboard settings (click the three-dot menu on the dashboard) for a visibility or sharing setting.
Pipeline Revenue shows wrong values: Verify that opportunities have dollar values entered (an opportunity with 0 to pipeline totals). Check the pipeline filter in the widget configuration — it must match the pipeline where your real opportunities live.
Call Performance widget shows no data: Call reporting requires that calls flow through your GHL phone number (not a forwarded external number). Confirm your team is using the GHL app or GHL phone system for calls, not personal cell phones that aren’t tracked.
911.9 Using Data to Optimize Campaigns
A dashboard that you look at but don’t act on is decoration. The purpose of reporting is to identify the decisions that need to be made. Here is how to translate each report into an actionable decision.
9.1Attribution Report → Budget Reallocation
Pull your Attribution Report for the last 90 days. Sort first-attribution sources by number of contacts created. Then sort last-attribution sources by number of contacts who reached “Closed Won” in your pipeline.
The gap between these two lists is your opportunity. If Facebook generates 60% of first-attribution contacts but only 20% of last-attribution wins, Facebook may be excellent at brand awareness but something in your nurture sequence is losing those leads before they convert. The question is not “should we reduce Facebook spend?” — it is “what is happening between first Facebook touch and the conversion event that we could fix?”
Conversely, if Google paid search generates only 15% of first-attribution contacts but 40% of last-attribution wins, your Google budget is punching above its weight in revenue generation. This is the signal to increase investment there.
9.2Call Report → Follow-Up Protocol Changes
Pull your Call Report, filter to inbound calls, and look at the missed call rate by hour of day and day of week. Where are the gaps in coverage? If your missed call rate spikes from 3–5 PM on Fridays, that’s when you need either additional staffing or a Voice AI agent configured to handle overflow. The data tells you where the coverage problem is. You decide how to solve it.
9.3No-Show Rate → Reminder Sequence Audit
If your Appointment Report shows a no-show rate above 15%, your reminder workflow is not working as designed. In GHL → Automation → Workflows, open your appointment reminder workflow and check the execution log for the last 50 appointments that no-showed. Were the reminders sent? Were they opened? Where in the sequence did engagement drop off?
Common causes: reminder SMS not sending (A2P registration expired or throttled), reminder email going to spam (authentication issue), no SMS confirmation sent at time of booking, or reminder timing is wrong (only sending 24-hour reminder but not 1-hour reminder before the appointment).
Each no-show that your reminder workflow should have prevented is a recoverable revenue event. Fix the workflow, rerun the data at 30 days.
1011.10 Case Study: An Agency Replaces Monthly PDFs With Live Client Dashboards — and Retains Three Clients Who Were About to Churn
Digital Velocity, a 12-person marketing agency in Chicago, was losing clients. Not because the results were bad — their average client saw 34% more leads in year one — but because the clients could not see the results. Reporting was a monthly PDF delivered on the 5th of the following month, 35 days after most of the data was already old. By the time the report arrived, clients had spent two weeks wondering if anything was working.
Three clients were on the verge of cancellation. All three cited the same reason: “I can’t tell what we’re getting for our investment.”
The agency deployed GHL’s custom dashboard for every client within one week. Each client received a branded, read-only dashboard link showing: new leads by source (updated daily), pipeline value by stage, call answer rate, appointment attendance rate, and current Google star rating.
The impact was immediate. Clients who had been sending frustrated emails about results visibility suddenly stopped sending them. They were checking the dashboard themselves — sometimes daily. When a campaign launched, they could watch leads appear in real time. When a workflow change reduced no-shows, they saw the no-show rate drop in their dashboard.
The three churning clients stayed. Two of them increased their monthly retainer within 60 days, citing confidence in the agency’s transparency and delivery visibility. The agency’s average client retention period extended from 11 months to 19 months over the following year.
The cost of building 40+ client dashboards: approximately one afternoon’s work using GHL’s dashboard builder, replicated per client via a template.
The agency’s operations lead summarized it well: “We were generating great results but delivering terrible evidence. The dashboard didn’t change our results — it changed our clients’ experience of them.”
11🎯 Your Turn: Apply It to Your Business
Data only changes behavior when you look at it regularly, understand what it means, and make decisions from it. This section is about building that habit.
1. Run your first Attribution Report. In GHL → Reporting → Attribution, pull the last 90 days. Look at your top five first-attribution sources by contact count. Now look at your top five last-attribution sources by contacts who converted to a pipeline stage or paid. Do the lists match? Where are the biggest gaps? Write down one decision the attribution data suggests you should make — even if you don’t act on it yet.
2. Connect at least one ad account. If you run Google Ads or Facebook Ads, connect the account now. In Settings → Integrations → Google Ads (or Facebook Ads), follow the authorization flow. Once connected, open Reporting → Google Ads (or Facebook) and review the campaign-level performance data. Does your highest-spend campaign produce the most contacts? Or is there a lower-spend campaign with better cost-per-lead that deserves more budget?
3. Build your Command Center Dashboard. Follow the Lab 11 steps to build your five-widget business dashboard. Do it now — not later this week. Once it’s built, bookmark it and commit to opening it every morning for the next 30 days before checking email. By day 10, you will know your business metrics by heart. By day 30, you will wonder how you ran the business without it.
4. Identify your highest-impact operational problem from the data. After reviewing your dashboard for one week, identify the single metric that most needs improvement. No-show rate above 20%? Missed call rate above 20%? Facebook attribution producing 40% of leads but 5% of revenue? Pick one. Build one specific workflow change or configuration update to address it. Measure the impact after 30 days.
5. Set up a shared dashboard for your team or one client. If you have a team, create a shared dashboard for your sales manager showing pipeline value, call answer rate, and appointment attendance rate. If you are an agency, create a client dashboard for your longest-running client using the template from Section 11.7. Send them the link. Their reaction will tell you whether your reporting was adequate before.
12Chapter Summary
GHL’s reporting suite gives every business — from a solo operator to a multi-location agency — the instrument panel to understand where leads come from, which activities produce revenue, and where operations are underperforming. Attribution reporting connects ad spend to CRM outcomes. Call reporting reveals the coverage gaps that cost the most. Appointment reporting identifies the no-show problems that drain revenue silently. Custom dashboards make all of this visible at a glance, shareable with clients, and actionable on a daily basis.
The business that makes decisions from data wins. Not because data is infallible, but because disciplined measurement compounds — every decision informed by data makes the next decision better, and the cycle of improvement accelerates over time.
Build the dashboard. Look at it daily. Let what you see change what you do.
13Glossary
Attribution The process of assigning credit to marketing touchpoints that contributed to a conversion or sale. GHL supports First Attribution (first touchpoint) and Last Attribution (most recent touchpoint before conversion).
First Attribution An attribution model that assigns full credit for a conversion to the very first marketing touchpoint that brought a contact into the CRM system. Useful for understanding what sources initially attract leads.
Last Attribution An attribution model that assigns full credit for a conversion to the most recent marketing touchpoint before the conversion event occurred. Useful for understanding what sources close deals.
UTM Parameters URL query string tags (utm_source, utm_medium, utm_campaign, utm_term, utm_content) added to marketing links to identify the source and context of incoming traffic for attribution purposes.
Call Reporting GHL’s report showing all phone activity — inbound and outbound call counts, answer rates, missed call counts, duration, and recording access — filterable by date, number, user, and outcome.
Appointment Report GHL’s report showing the scheduling funnel metrics — bookings, cancellations, no-shows, and attendance rates — broken down by calendar, service type, and team member.
No-Show Rate The percentage of confirmed appointments where the contact neither attended nor cancelled. Benchmark: under 10% is healthy. Above 20% indicates a reminder workflow or booking commitment problem.
Answer Rate In call reporting, the percentage of inbound calls that were answered by a human or AI agent. Used to identify coverage gaps in phone availability.
Custom Dashboard A user-configured reporting view in GHL assembling any combination of metric widgets into a single screen. Shareable via read-only link with team members or clients.
Facebook Conversions API (CAPI) A server-to-server integration between GHL and Meta that sends conversion events directly from the CRM to Facebook’s ad platform, bypassing browser-based pixel tracking and improving attribution accuracy in privacy-restricted environments.
Conversion Import The feature that sends GHL events (contact creation, pipeline stage changes, purchases) back to Google Ads as conversion signals, enabling Google’s smart bidding algorithms to optimize toward revenue-generating leads rather than raw form submissions.
Read-Only Dashboard Link A shareable URL that gives any recipient access to a live, auto-refreshing view of a custom GHL dashboard without requiring a GHL account login. Used by agencies to provide real-time reporting transparency to clients.
Chapter 12 covers the Social Planner — connecting your social media platforms, scheduling content, using AI to generate posts, and managing multiple clients’ social accounts from a single GHL interface.
1411.12 Conversation Reports: The First Response Time Problem
The Conversation Report is the operational heartbeat of your customer communication infrastructure. It measures not just how many conversations are happening, but whether they are being handled at the speed and quality that modern customers expect.
14.1Key Conversation Metrics
Navigate to Reporting → Conversations Report. Filter by date range and channel. Key metrics:
Total Conversations: The absolute count of unique conversation threads opened in the period. Trend upward is almost always positive — it means your marketing is generating more inbound interest.
First Response Time (FRT): The average time between a contact’s first message in a conversation and the first reply from your team or AI. This is the single most important customer service metric in any business that sells through conversations. Industry benchmarks: under 5 minutes for SMS and web chat; under 1 hour for email. Above these thresholds, conversion rates decline measurably.
Resolution Time: Average time from conversation opened to conversation marked closed or resolved. A high resolution time can indicate escalation bottlenecks, unclear ownership, or conversations being left open unnecessarily.
Conversations by Channel: Breakdown of conversation volume by SMS, email, Facebook Messenger, Instagram DM, web chat, etc. Reveals which channels your audience prefers and where staffing focus should be concentrated.
Open vs. Closed: The count of conversations currently open versus closed in the period. A growing “open” pile is an operational warning — conversations are accumulating faster than they are being resolved.
14.2Using FRT to Improve Revenue
First Response Time has a direct and documented relationship with sales conversion rates. The Lead Response Management study (often cited in CRM contexts) found that responding within the first five minutes of lead submission results in nearly 8x higher qualification rates than responding within 24 hours.
In GHL, you can measure this directly. Pull your Conversation Report for the last 90 days and note your average FRT. Then, using your Attribution or Pipeline Report, compare conversion rates for contacts whose first message was responded to within 5 minutes versus those who waited over an hour. In most businesses, the difference is not subtle.
If your FRT is over 15 minutes during business hours, the fastest fix is:
Enable Conversation AI in Suggestive Mode — the AI drafts responses instantly while your team reviews
Activate Auto-Pilot Mode for initial FAQ responses on SMS and web chat channels
Configure workflow notifications: when a new conversation opens unassigned, send an immediate internal alert to the on-duty team member
If your FRT is high outside business hours, Conversation AI Auto-Pilot is the complete solution — the AI handles after-hours inquiries at full speed, and escalates to human when the team is back online.
14.3Building a Weekly Communication Health Review
Set a standing 30-minute team meeting weekly — or a solo review if you’re running lean — using the Conversation Report as the agenda:
What was our average FRT this week? Up or down from last week?
Which channels had the highest FRT? Why?
Are there open conversations over 48 hours old that need immediate attention?
What were the top three conversation topics or questions this week? Should any of them be added to the Conversation AI knowledge base or Snippet Library (Chapter 6)?
Did Conversation AI escalate appropriately this week, or were there cases where it should have escalated but did not?
This 30-minute review, done consistently, drives continuous improvement in the communication layer of your business. The companies with the best customer experience ratings are not necessarily those with the best service — they are the ones that review and improve their communication processes relentlessly.
1511.13 Agency Reporting: Managing Multiple Sub-Account Dashboards
For agencies managing GHL sub-accounts on behalf of clients, the reporting architecture unlocks powerful multi-account visibility. The agency-level dashboard in GHL allows you to monitor key metrics across all client sub-accounts without switching between accounts.
15.1Accessing Agency-Level Reports
In the GHL Agency view (the main account, not a sub-account), navigate to Reporting at the agency level. Here you can view:
Sub-account activity summaries (new contacts, call volume, pipeline value)
Across-account performance comparisons
Sub-account usage metrics (automation runs, email sends, SMS usage)
For each individual client sub-account, build a custom dashboard (as in Lab 11) tailored to that client’s KPIs. The read-only link for that dashboard goes into your agency’s client reporting toolkit — delivered automatically, refreshed in real time, no PDF generation required.
15.2Building Standardized Client Dashboard Templates
If you manage more than five clients, build a standard dashboard template that you replicate for each new client at onboarding. The template should include the five to seven metrics that matter across all your client types:
Template Widgets:
New Leads (This Month) — by attribution source
Pipeline Value — by stage
Appointments Booked and Attended
Call Answer Rate
Review Count and Star Rating (current month)
Email Campaign Open Rate (if applicable)
When onboarding a new client, duplicate this template, rename it, and share the read-only link in the client’s onboarding package. The dashboard is populated automatically as data flows in — no manual setup required per client beyond the initial connection of their GHL account.
15.3The Client Reporting Call
Replace your monthly reporting call’s slide deck with a shared screen of the live GHL dashboard. Walk the client through each widget in real time. Use the data to frame the conversation: “Here’s what the data shows. Here’s the decision it suggests. Here’s what we’re doing about it.”
This format accomplishes three things that a PDF report cannot: it demonstrates real-time transparency (you have nothing to hide because the data is live), it makes the conversation data-led rather than narrative-led (you are both looking at the same source of truth), and it trains the client to evaluate their investment in terms of pipeline value and lead acquisition rather than vanity metrics like social followers.
1611.14 Advanced Attribution: Multi-Touch Analysis
First and Last attribution models each tell part of the story. As your tracking data matures, you may want to move toward a more nuanced view of how multiple touchpoints contribute to conversions.
While GHL’s native attribution models are First and Last, you can build a rough multi-touch analysis using GHL’s data by examining the contact timeline for your highest-value won opportunities.
16.1Reading the Contact Timeline for Multi-Touch Insights
Open any high-value won opportunity. Navigate to the contact’s Activity tab. The timeline shows every recorded interaction — first page visit, form submission, emails opened, calls received, SMS clicked, appointments attended, pipeline stage changes.
For your last 20 won opportunities, document:
First recorded touchpoint (first attribution)
Number of touchpoints between first and conversion
Type of touchpoint that immediately preceded conversion (last attribution)
Total days from first touch to close
Aggregate these patterns. You will typically find that:
High-value customers touch more channels and more times before converting
Certain channels (often email or phone) dominate the last-touch position even when the first touch was paid advertising
Average time-to-close for specific first-touch sources varies significantly (Facebook leads may close faster than organic search leads, or vice versa, depending on your funnel)
This manual analysis is not a substitute for a dedicated multi-touch attribution platform. But for most small-to-medium businesses, it provides sufficient insight to make meaningful budget allocation decisions without the cost and complexity of enterprise-level attribution software.
16.2When to Invest in External Attribution Tools
Consider third-party attribution tools (such as Northbeam, Triple Whale for e-commerce, or Rockerbox) when:
Your monthly ad spend exceeds $25,000 across multiple platforms
You are running campaigns on four or more paid channels simultaneously
Cross-device attribution (mobile ad to desktop conversion) is a significant factor in your customer journey
You have a long sales cycle (over 60 days) where single-touch models lose too much signal
For businesses spending under $25,000/month in paid media, GHL’s native First and Last attribution models — combined with consistent UTM discipline — provide sufficient data for the decisions most businesses need to make.
1711.15 Scheduled Reports: Automating Your Own Data Delivery
One of the underused capabilities in GHL’s reporting suite is the ability to schedule automated report delivery to your team or clients by email. Instead of manually pulling reports and forwarding them, configure GHL to deliver them automatically.
17.1Setting Up Scheduled Reports
Navigate to Reporting → [Any Report Type] → Schedule Report (found in the report’s settings or overflow menu).
Configure:
Recipients: Email addresses to receive the report
Frequency: Daily, weekly, monthly
Time: What time the email sends (morning delivery recommended for business-hours relevance)
Date range: What time window the report covers (last 7 days for weekly, last 30 days for monthly)
Recommended scheduled reports for most businesses:
Weekly Call Summary (sent Monday at 7 AM): Last 7 days of call volume, answer rate, and missed calls — sets the operational tone for the week
Monthly Attribution Report (sent 1st of month): Last 30 days of lead sources by contact count — informs monthly budget decisions
Weekly Appointment Report (sent Monday at 7 AM): Last 7 days of bookings, no-shows, and attendance rate — keeps the scheduling health visible
For agencies, configure client-specific scheduled reports using sub-account data and set them to deliver to the client’s inbox automatically — giving clients proactive data visibility without requiring any agency staff time to generate or send reports.
1811.16 Discussion: The Ethics of Data-Driven Marketing
GHL’s reporting tools give marketing teams unprecedented visibility into customer behavior — every ad clicked, every page visited, every email opened, every call made. This visibility enables optimization. It also raises questions about how contact-level behavioral data should be used.
18.1The Data Use Question
When you use Last Attribution data to identify that certain ad creatives convert better among contacts aged 45–65, and then target that demographic more aggressively — is that responsible data use? Most marketers would say yes. When you use call recording data to identify which emotional language leads to faster closes and script your sales team accordingly — is that manipulation or simply good training?
These questions do not have universally accepted answers. They exist on a spectrum between legitimate optimization and practices that reasonable observers would find objectionable. Marketing attribution data accelerates movement along that spectrum in both directions.
18.2Data Privacy Considerations
As you build your reporting infrastructure, build your data hygiene practices alongside it:
Contact consent: Ensure every contact in your system has consented to the communications being tracked. Chapter 0 covered SPF/DKIM/DMARC for email — the same philosophy applies to data: documentation of consent is the foundation of defensible practice.
Retention limits: Establish a data retention policy. How long do you keep call recordings? GHL stores them indefinitely by default — set a 90-day or 6-month deletion schedule for recordings that are no longer needed for training or legal purposes.
Data access controls: Limit access to detailed attribution and call data to team members who need it for their role. Reporting transparency with clients means showing them their results — it does not mean sharing other clients’ data or internal performance benchmarks.
Discussion Prompt: At what point does behavioral tracking and attribution cross from legitimate marketing optimization into ethically problematic territory? Is there a meaningful difference between tracking a contact’s on-site behavior to serve them more relevant content versus using that data to manipulate the timing and framing of sales messages? Use one scholarly or industry source to support your argument and engage substantively with at least two peers’ responses.