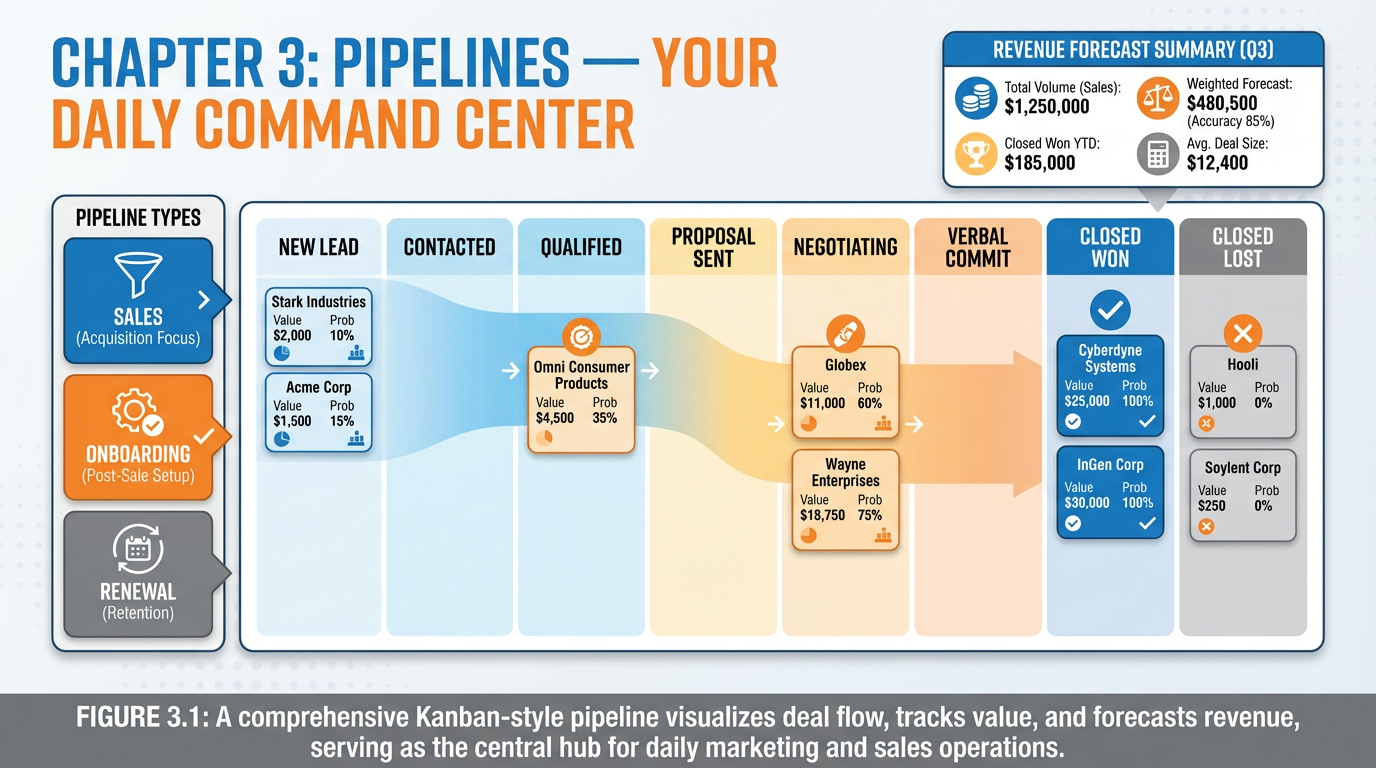
Figure 1:Chapter 3 Overview: A Kanban-style pipeline board is your business’s visual nervous system — showing where every deal stands, how much revenue is at risk, and exactly what needs your attention today.
Here is a question worth sitting with for a moment: Why does a grocery store arrange its products in aisles instead of one giant pile in the middle of the floor?
The answer is deceptively simple — because your brain cannot process a pile. It can, however, process columns. It can scan left to right, identify patterns, and make decisions almost instantly when information is organized spatially. This is not a preference. It is a feature of your cognitive architecture, baked in over hundreds of thousands of years of evolution.
This same principle is why the Kanban board — born on a Toyota factory floor in post-war Japan, adopted by software teams in the 1980s, and now powering the world’s most successful sales organizations — remains one of the most powerful productivity tools ever invented. When you look at a CRM pipeline board, you are not looking at software. You are looking at a deliberate interface designed for the human brain.
In this chapter, you will learn how to build that interface — not as a passive record-keeper, but as the dynamic, living command center from which you run your entire revenue operation every single day.
13.1 Why the Human Brain Loves Columns: The Kanban Principle
In 1948, Toyota engineer Taiichi Ohno was studying the American supermarket system. What struck him was not the products themselves, but the replenishment system. A shelf would empty, a signal would go out, and stock would flow from the back to refill it — just in time, no more and no less. The system was self-regulating. Waste was minimized. Visibility was total.
Ohno brought this idea back to Toyota’s manufacturing floors and called it kanban — the Japanese word for “signboard” or “visual card.” Workers used physical cards to signal that a station had completed its work and was ready to receive the next item. The result was transformative: cycle times dropped, defects became visible, and the entire production flow could be understood at a glance.
Fast forward to the late 1980s. Software engineers at places like Microsoft and Motorola were wrestling with a different kind of chaos — too many tasks, unclear priorities, invisible bottlenecks. They adapted Ohno’s visual card system to software development: work items became digital cards, production stages became columns, and the result became the modern Kanban board.
Fast forward again to today. Every sales team on the planet uses a version of this same system. The CRM pipeline board is a Kanban board. The opportunities are the cards. The stages are the columns. And the signal that something needs to move is as visible — and as urgent — as it was on that Toyota factory floor in 1948.
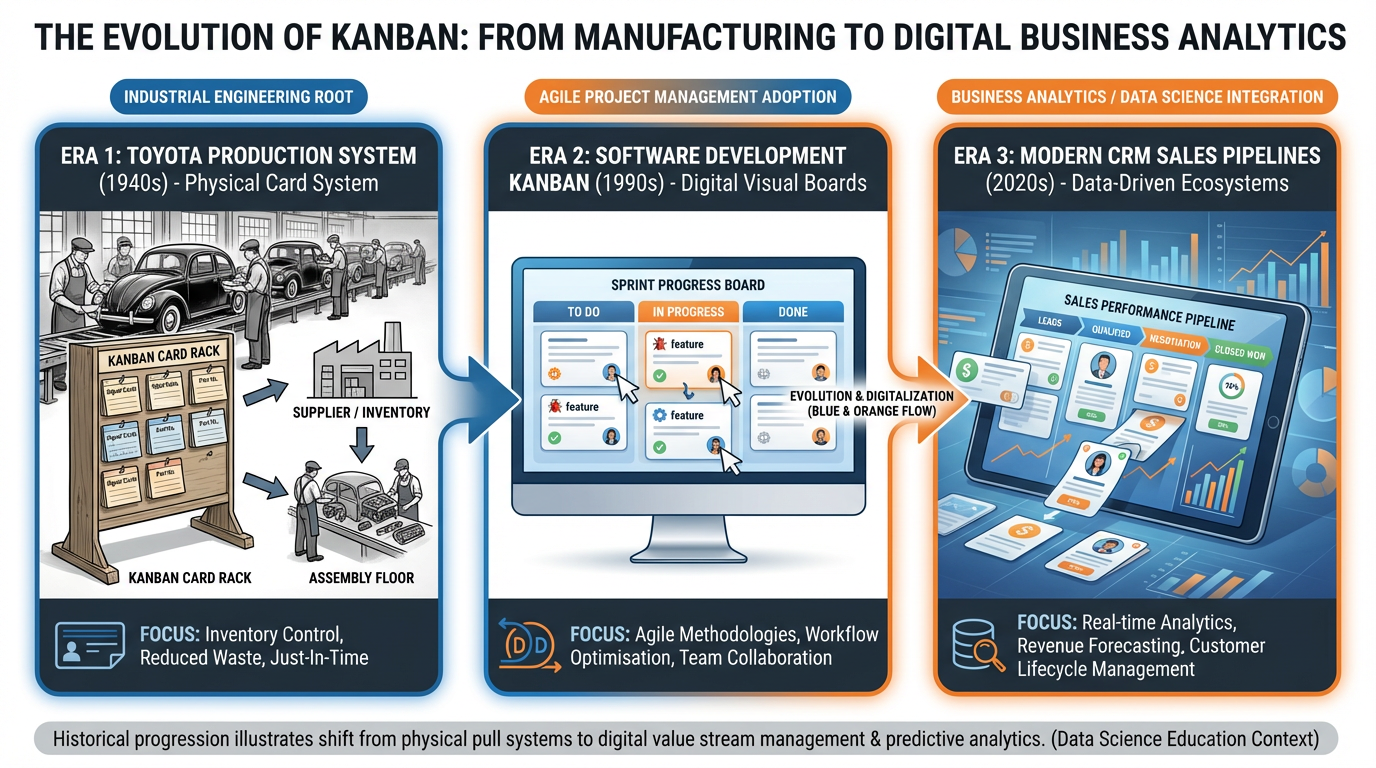
Figure 2:Figure 3.1: The Kanban principle has traveled from Toyota’s factory floor to software teams to modern CRM sales pipelines — the underlying cognitive logic is identical in all three contexts.
Why does the column format work so well for the human brain? Cognitive psychology research points to three mechanisms:
Chunking. The brain organizes information into meaningful clusters. A column of “Qualified” deals is a chunk — your brain can scan it and immediately understand “these people have been vetted.” Mixing qualified and unqualified leads in the same view destroys this chunking.
Working memory load reduction. Visual layouts offload information from your working memory onto the environment. Instead of mentally tracking where each deal stands, you can look at where each deal stands. The pipeline becomes an external memory system.
Pattern recognition. When you see a stage with fifteen cards in it and the next stage has two, your brain immediately flags a bottleneck — without any math, without any analysis. The pattern speaks for itself.
So what does this mean for the humans in the room? It means your pipeline is not just an organizational tool. It is a cognitive prosthetic — one that makes you smarter, faster, and more decisive every time you open it.
23.2 Opportunities vs. Contacts — The Critical Distinction
One of the most common mistakes new CRM users make is treating contacts and opportunities as the same thing. They are not. Conflating them creates confusion, data chaos, and forecasting that is about as reliable as a horoscope.
Here is the distinction, stated plainly:
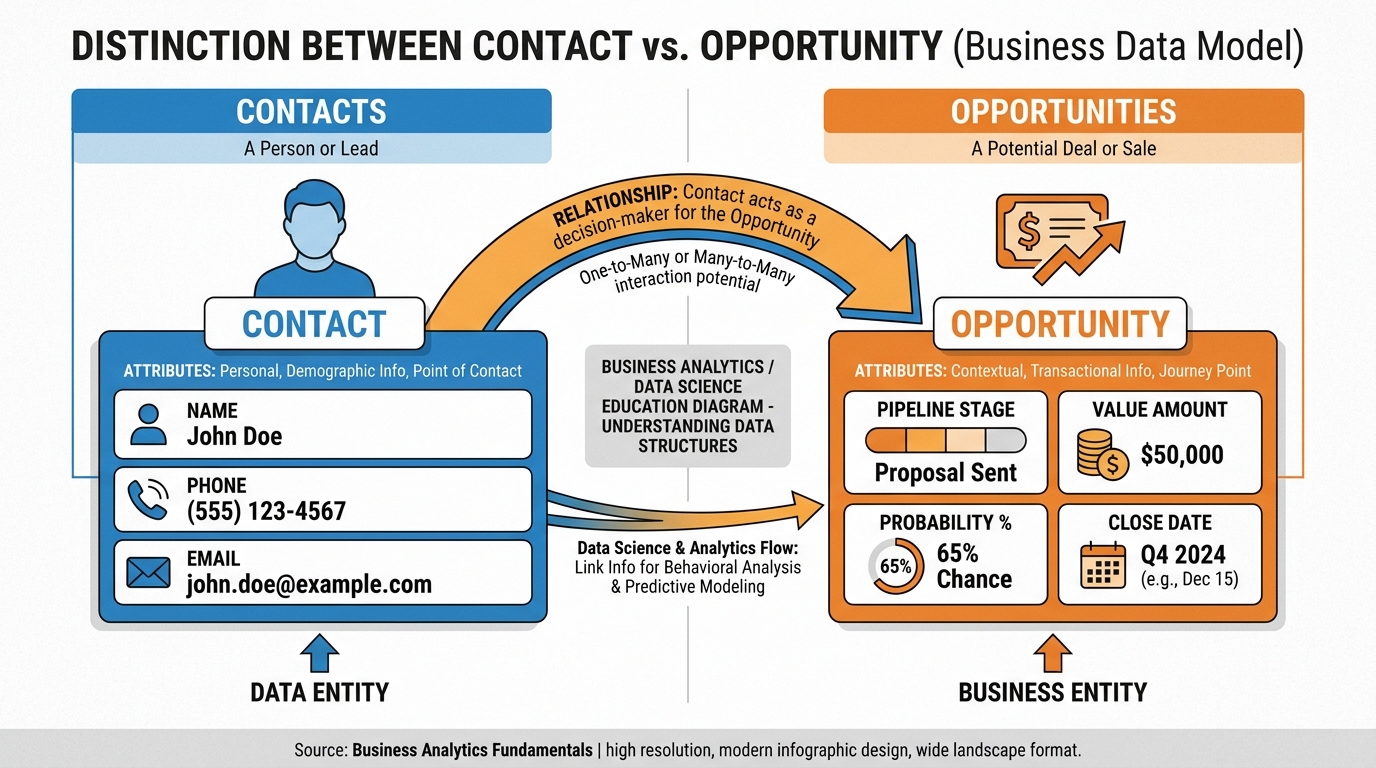
Figure 3:Figure 3.2: A contact is a person; an opportunity is a potential transaction. One contact can fuel multiple opportunities across your pipeline, each with its own value, stage, and probability.
This distinction matters enormously in practice. Consider a mortgage broker’s database. She has 2,400 contacts. But she has 47 active opportunities — specific clients with specific loan applications at specific stages of the approval process. Her pipeline does not show 2,400 cards. It shows 47. The noise is filtered out. What remains is signal.
When you build your pipeline in VibeReach, you will always be working with opportunities, not raw contacts. The contact record is the foundation. The opportunity is the action layer on top.
33.3 Designing a Pipeline That Mirrors How You Actually Sell
Before you open VibeReach and start clicking, do something more valuable: map how you actually close a deal. Not how you think you should close a deal. Not the idealized process from a sales training video. The real, messy, actual sequence of events that takes a stranger and converts them into a paying client.
For most service businesses, that sequence looks something like this:
Every business has a version of this flow. The specific steps differ — a merchant cash advance company’s flow looks different from a wedding photographer’s flow — but the underlying structure is universal: awareness leads to qualification leads to presentation leads to commitment leads to fulfillment.
Your pipeline should be a direct translation of this flow into stages. Each stage should represent a completed action that moved the deal forward. If a stage cannot be defined by a specific, verifiable event, it is not a stage — it is a feeling. Feelings belong in your journal, not your pipeline.
The three questions to ask for every stage you consider adding:
What event marks entry into this stage? (Something happened — a call was made, a proposal was sent, a document was signed)
What action is required while in this stage? (What does the salesperson do here?)
What event triggers the move to the next stage? (Something else happens — a response received, a decision made, a contract executed)
If you cannot answer all three questions, the stage is not ready.
43.4 Stage Design: The Science of Naming Things People Will Actually Move
Stage names are not trivial. They are behavioral prompts. A stage called “Follow Up” is a dead end — every deal that touches it just... sits there, because “follow up” describes an eternal state, not a completed action. A stage called “Proposal Sent” is a trigger — the second a proposal goes out, the deal snaps into that column and everyone knows what happened and what comes next.
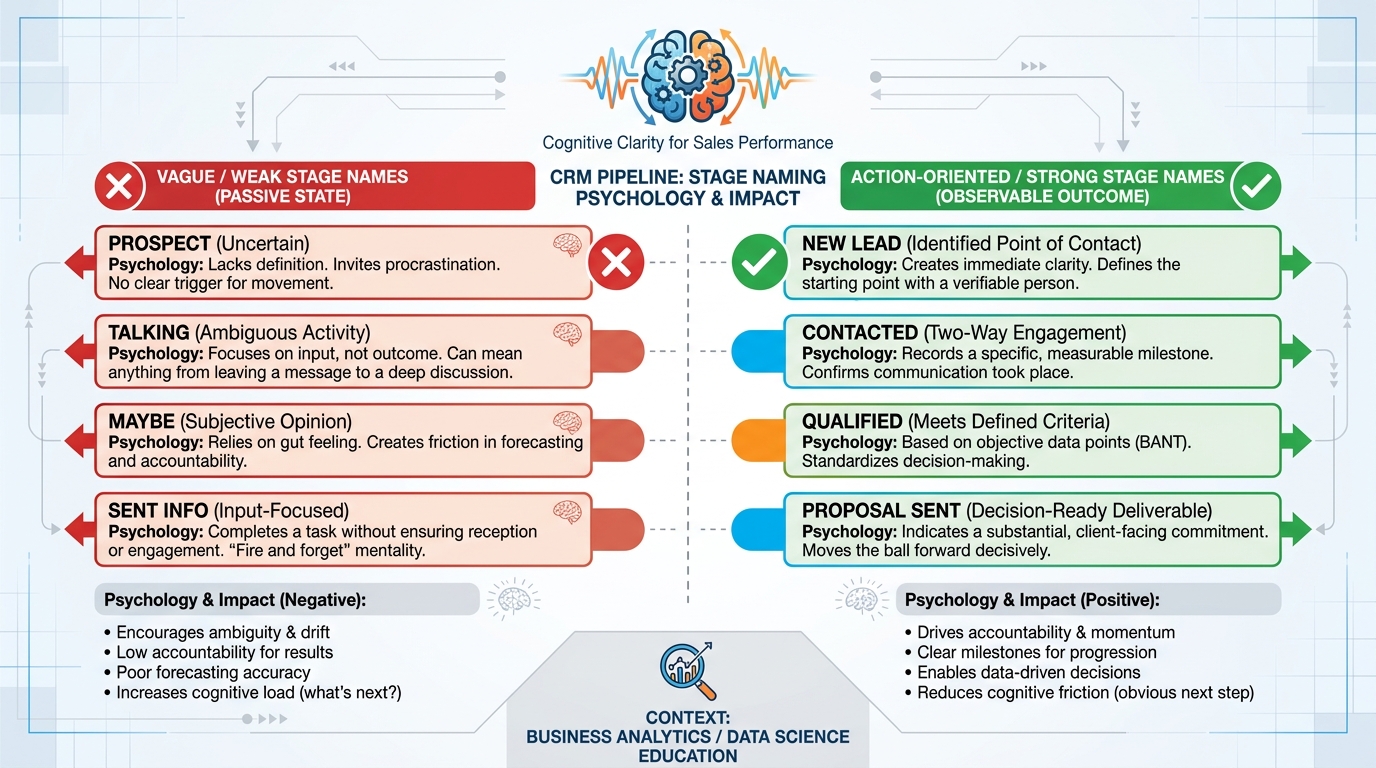
Figure 4:Figure 3.3: Stage naming psychology matters. Vague state-based names breed stagnation. Action-based names create momentum and make pipeline hygiene nearly automatic.
The naming principles that separate high-performing pipelines from cluttered ones:
Use past-tense action verbs where possible. “Proposal Sent” rather than “Proposal.” “Contract Signed” rather than “Contracting.” The past tense signals completion and clarity.
Be specific to your process. “Discovery Call Completed” is better than “Contacted.” It tells you exactly what happened and what level of qualification has been achieved.
Limit to 6–9 stages. Research on working memory (Cowan, 2001) suggests humans can comfortably track about 7 items simultaneously. A pipeline with 15 stages is not sophisticated — it is paralyzing. If you need more than 9 stages, consider whether you actually need multiple pipelines.
Reserve “Closed Won” and “Closed Lost” as terminal stages. These are the exits. Everything else is the journey. In VibeReach, Won and Lost status is built in and does not need to be added as manual stages.
Recommended 8-Stage Sales Pipeline
New Lead — Contact entered system
Contacted — First outreach made
Qualified — Fit confirmed, need identified
Proposal Sent — Formal offer delivered
Negotiating — Price/terms discussion active
Verbal Commit — Oral agreement reached
Closed Won — Contract signed, payment collected
Closed Lost — Deal ended without close
Recommended 7-Stage SaaS Pipeline
MQL — Marketing qualified lead
SQL — Sales qualified (demo requested)
Demo Completed — Live product demo done
Trial Active — Free trial running
Proposal Sent — Paid plan offer delivered
Closed Won — Subscription activated
Closed Lost — Churned before converting
Recommended 6-Stage Consulting Pipeline
Inquiry Received — Initial contact made
Discovery Scheduled — Consultation booked
Discovery Completed — Needs documented
Proposal Delivered — Scope and fee presented
Agreement Signed — Engagement contract executed
Project Started — Kickoff meeting held
53.5 Multiple Pipelines for Multiple Motions (Sales, Onboarding, Success, Renewal)
A single pipeline is a start. A pipeline system is a competitive advantage.
Here is the insight that separates sophisticated operators from everyone else: the sale is not the end of the customer journey — it is the beginning of the revenue journey. Every stage after “Closed Won” is equally important to your business’s financial health, and those stages need their own pipelines.
Consider the full customer lifecycle for a digital marketing agency:
Sales Pipeline — The journey from lead to signed client. Ends at Closed Won.
Onboarding Pipeline — Starts the moment a client signs. Moves through account setup, strategy call, asset delivery, first campaign launch, and 30-day review. Ends at “Fully Onboarded.”
Client Success Pipeline — Ongoing relationship management. Monthly check-in, quarterly business review, upsell conversation, and satisfaction survey. Runs in parallel with service delivery.
Renewal Pipeline — Begins 90 days before contract expiration. Moves through renewal conversation, proposal sent, renewal agreed, and contract signed for another term.
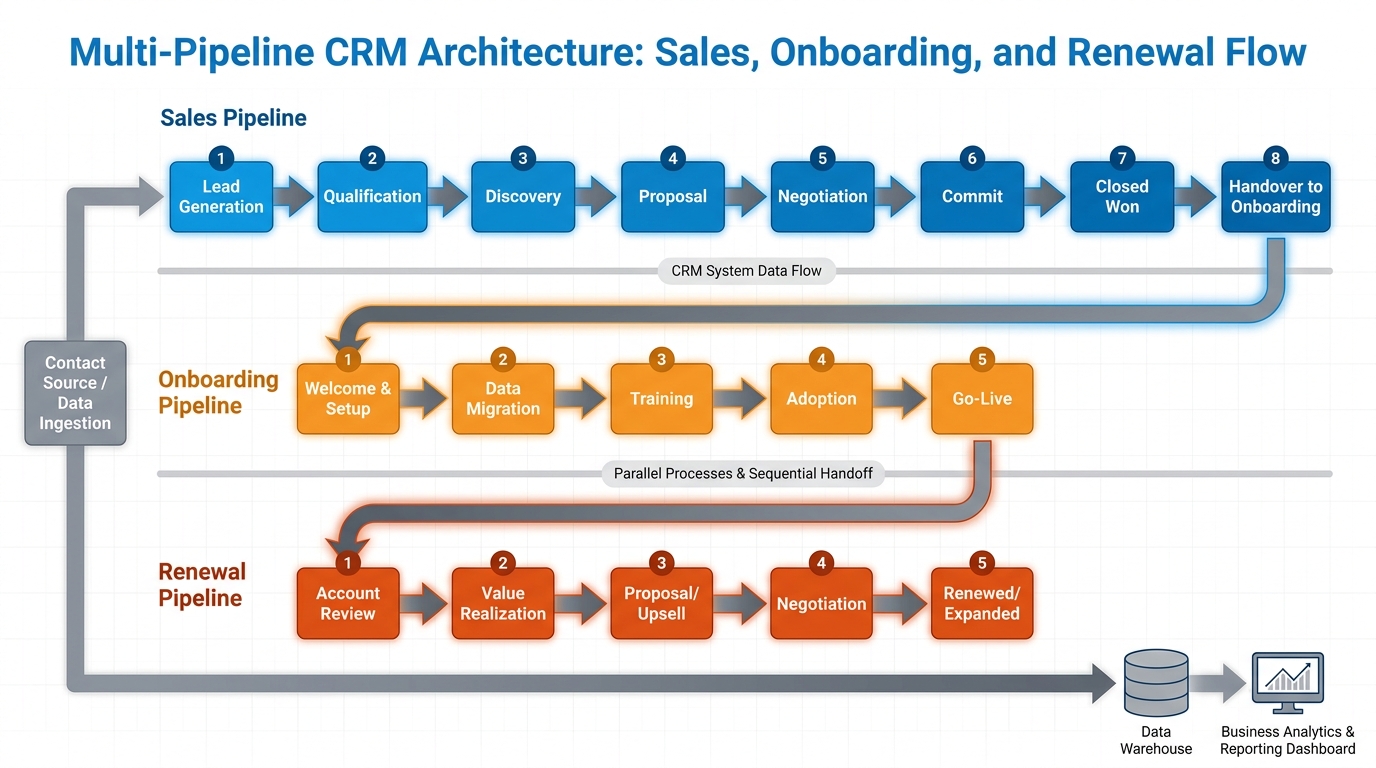
Figure 5:Figure 3.4: A mature revenue operation runs multiple parallel pipelines. When a deal closes in the Sales Pipeline, it simultaneously opens an opportunity in the Onboarding Pipeline — creating a seamless, tracked handoff.
The power of this architecture is in the handoffs. When a deal closes in your Sales Pipeline, automation in VibeReach can instantly create a new opportunity in your Onboarding Pipeline — already populated with the client’s name, deal value, and assigned team member. The client never feels the handoff. Your team never drops the ball. The pipeline captures everything.
63.6 Deal Value, Probability, and Forecasting From the Board
The pipeline board becomes financially meaningful the moment you attach numbers to it. Two numbers, specifically: deal value and win probability.
When you multiply deal value by win probability across all open opportunities, you get your weighted pipeline forecast — a realistic estimate of revenue you can expect to close in a given period.
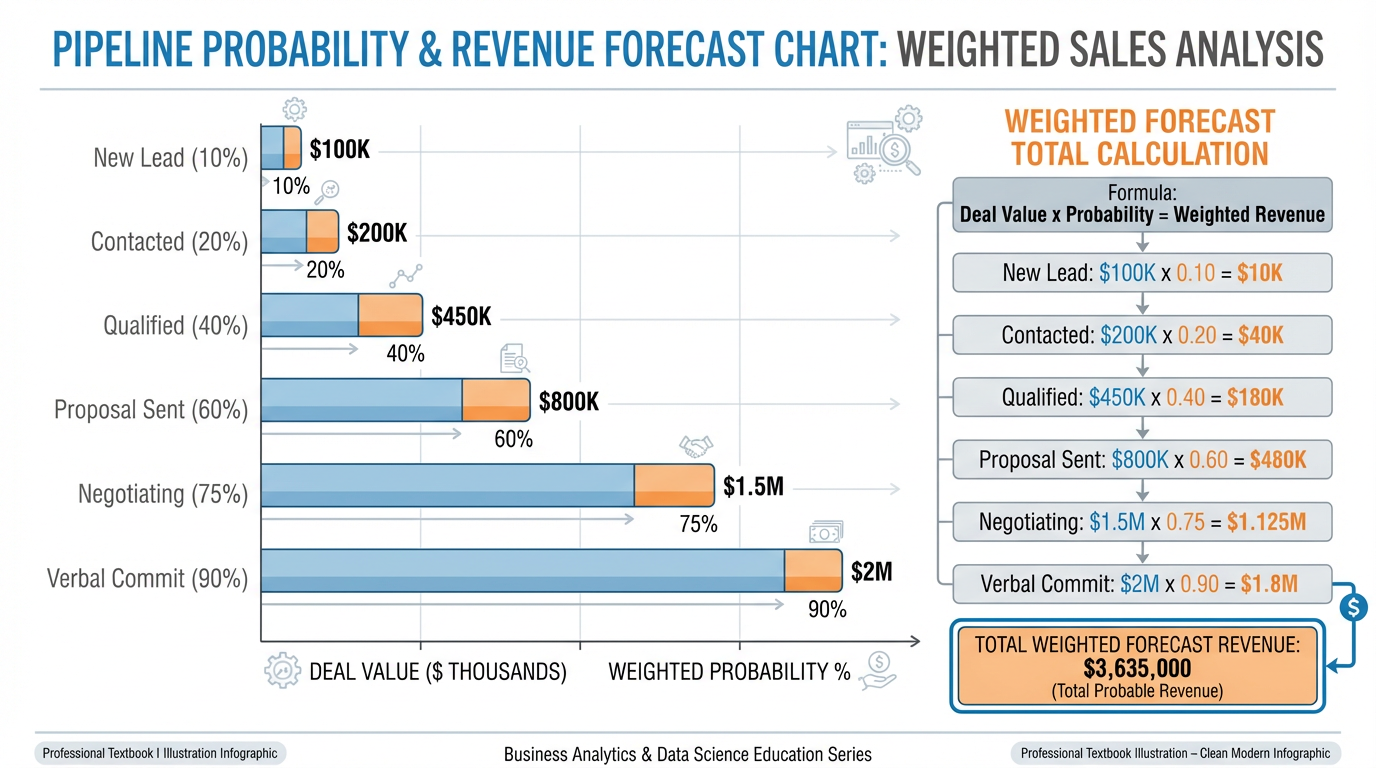
Figure 6:Figure 3.5: Weighted pipeline forecasting multiplies each deal’s value by its stage probability to produce a realistic revenue projection — far more accurate than simply summing all open deals.
Here is an example of weighted pipeline math in practice:
| Stage | Probability | Open Deal Value | Weighted Value |
|---|---|---|---|
| New Lead | 10% | $45,000 | $4,500 |
| Contacted | 20% | $32,000 | $6,400 |
| Qualified | 40% | $28,000 | $11,200 |
| Proposal Sent | 60% | $55,000 | $33,000 |
| Negotiating | 75% | $18,000 | $13,500 |
| Verbal Commit | 90% | $24,000 | $21,600 |
| Total | $202,000 | $90,200 |
Notice the gap: 202,000 in expected revenue. The weighted forecast of $90,200 is what a seasoned sales leader actually plans around. It accounts for the statistical reality that most early-stage deals do not close, and it produces a number that can drive actual business decisions — hiring plans, cash flow projections, and marketing spend.
In VibeReach, the pipeline dashboard calculates this weighted forecast automatically once you configure stage probabilities. You do not need a spreadsheet. You need accurate stage assignments.
73.7 The Morning Stand-Up Ritual: Running Your Day From the Pipeline
The most powerful thing you can do with your pipeline is make it the first thing you look at every morning. Not email. Not social media. Not a team chat. The pipeline board.
This 15-minute morning ritual — practiced by top-performing sales teams at companies from insurance agencies to tech startups — transforms a reactive day into a proactive one.
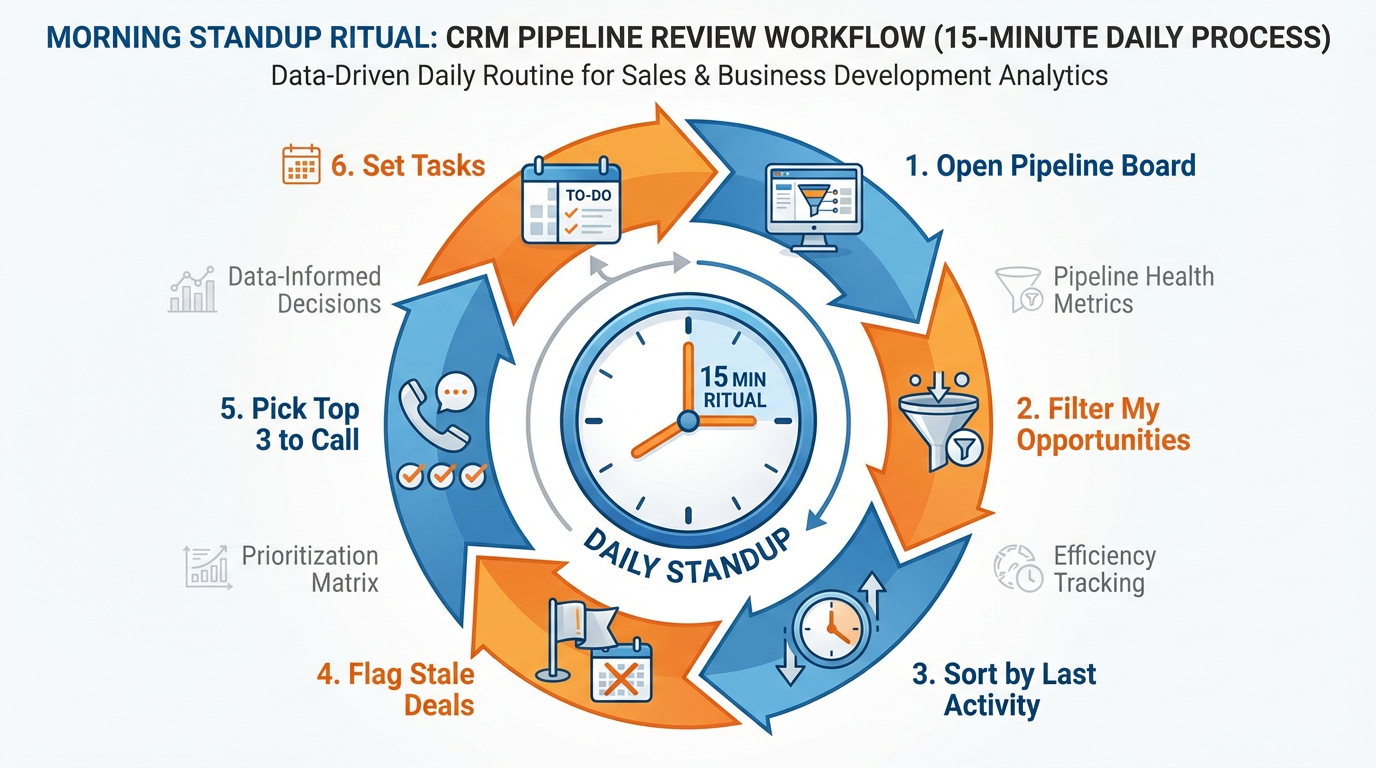
Figure 7:Figure 3.6: The 15-minute morning stand-up ritual. Each step builds on the last, ending with a focused, prioritized action list that drives the entire day’s revenue activity.
Here is the ritual, step by step:
Step 1 — Open your pipeline board (2 minutes). Go to Opportunities in VibeReach. Switch to board view. You are seeing the full landscape of your active deals.
Step 2 — Filter to “My Opportunities” (1 minute). If you manage a team, you want to see the full board. If you are a solo operator, filter to your own deals. Remove the noise.
Step 3 — Scan for aging deals (3 minutes). Look for deals that have not moved in 7+ days. In VibeReach, the “Last Activity” field tells you when something last happened on a deal. Any deal with no activity in 7 days is at risk of dying. Mark these mentally — they need attention today.
Step 4 — Check your late-stage pipeline (3 minutes). Deals in Negotiating, Verbal Commit, and Proposal Sent deserve your first attention every morning. These are the closest to revenue. Any friction here costs real money.
Step 5 — Identify your top 3 to contact today (2 minutes). Based on recency, deal value, and stage, pick the three deals you will actively advance today. Write them down or create tasks in VibeReach.
Step 6 — Set the day’s intention (4 minutes). For each of your top 3, decide the specific action you will take. “Call John to discuss the proposal timeline.” “Send contract to Maria.” “Email Carlos the revised pricing.” Specific actions, not vague intentions.
That is 15 minutes. That is the difference between a sales day that is driven by whoever shouts loudest and a sales day that is driven by what actually moves the business forward.
83.8 Pipeline Hygiene: When to Move, When to Mark Lost, When to Resurrect
A dirty pipeline is worse than no pipeline. When your board is cluttered with stale deals, ancient contacts who stopped responding, and wishful-thinking opportunities from months ago, the signal-to-noise ratio collapses. Your 15-minute morning ritual turns into an archaeological dig.
Pipeline hygiene is the discipline of keeping your board clean, current, and trustworthy.
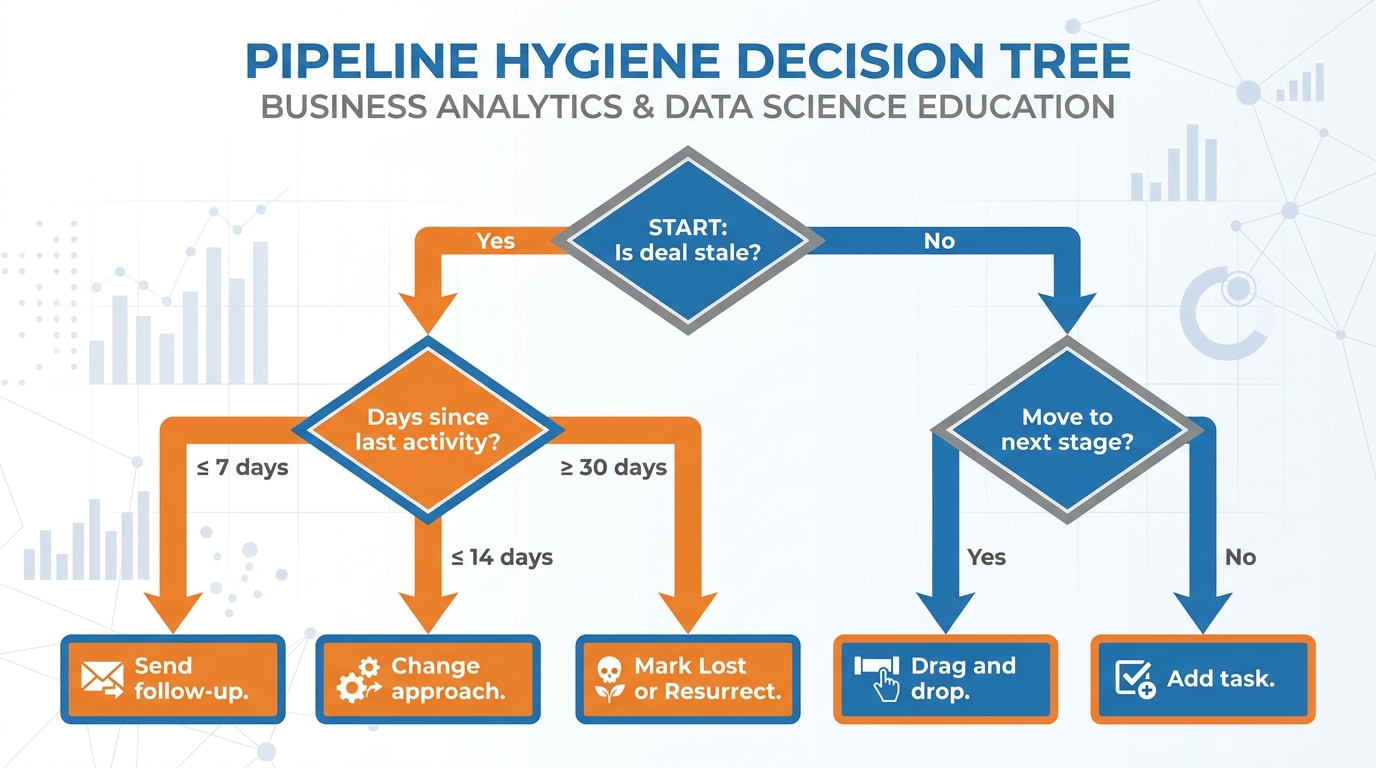
Figure 8:Figure 3.7: The pipeline hygiene decision tree. Apply this framework weekly to every deal that has been inactive — and your pipeline will remain a reliable forecasting tool rather than a digital junk drawer.
When to move a deal forward: Only when a specific qualifying event has occurred. Not because it has been sitting in a stage for too long. Not because you want the pipeline to look better. A deal moves when something happens — a call completed, a document signed, a decision made. Stage movement must be earned.
When to mark a deal Lost: Sooner than feels comfortable. Most salespeople hold onto deals long past their expiration date because marking them Lost feels like admitting failure. It is not. It is data collection. When you mark a deal Lost, always record the reason (Non-Responsive, Went with Competitor, Budget Eliminated, Timing Not Right). Over time, this loss reason data becomes your most valuable coaching and product development feedback.
When to resurrect: Some deals that go cold are genuinely dead — the prospect bought from a competitor and moved on. But many cold deals are simply dormant — the prospect has not bought anywhere else and still has the problem you solve. Quarterly resurrection campaigns that reach out to 90-day-old Lost deals with a fresh offer or new angle frequently uncover revenue that was written off prematurely.
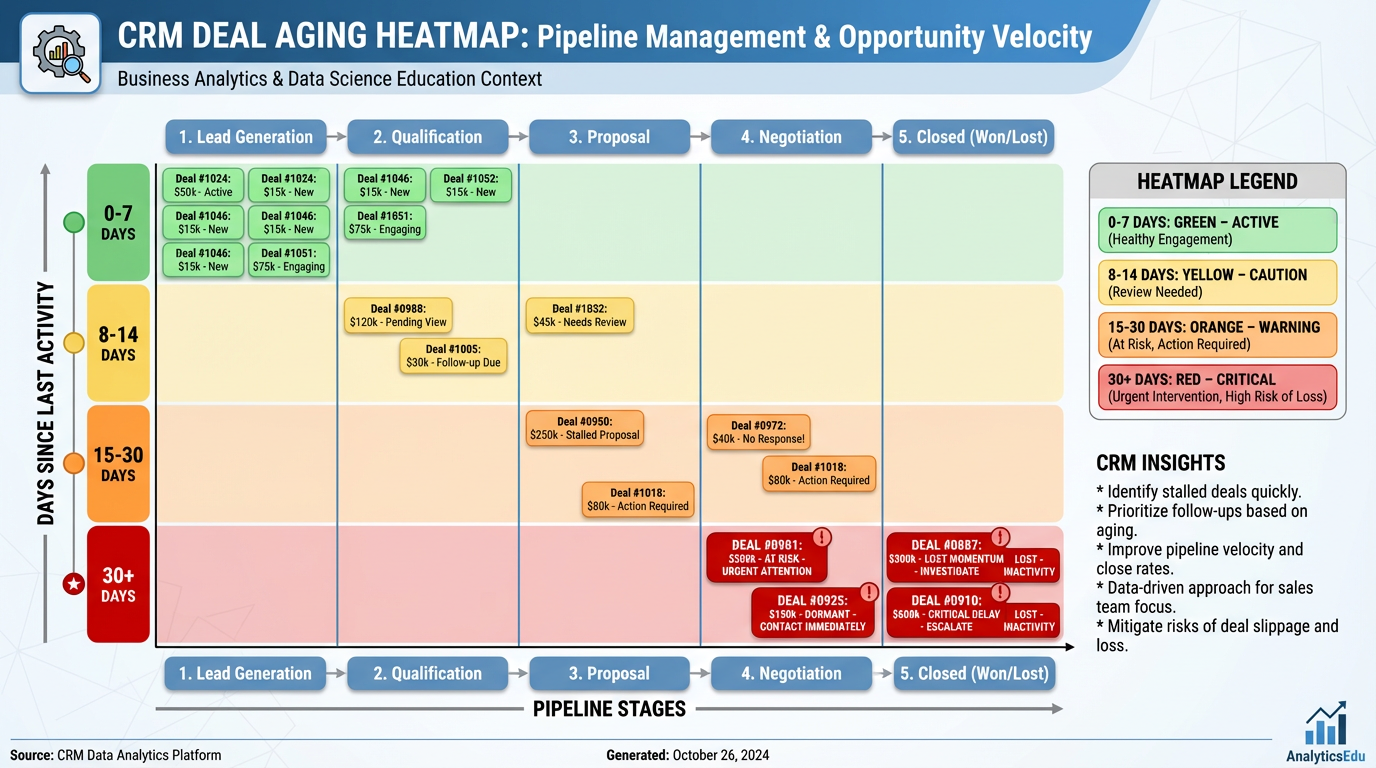
Figure 9:Figure 3.9 — Deal Aging Heatmap: Color-coding deals by days since last activity turns an abstract hygiene problem into an immediately actionable visual. Green deals are healthy. Red deals are emergencies.
93.9 Case Study: An Eight-Stage MCA Funding Pipeline That Cut Cycle Time from 21 Days to 9
A merchant cash advance (MCA) funding company in Miami was drowning in paper. Loan officers managed their deals on spreadsheets, sticky notes, and sheer willpower. The average deal took 21 days from application to funding. Conversion rate — the percentage of qualified applicants who actually received funding — hovered around 34 percent. The company was growing but barely profitable, with margins squeezed by the cost of the prolonged sales cycle.
The leadership team believed the problem was their underwriting process. They were wrong. The problem was visibility.
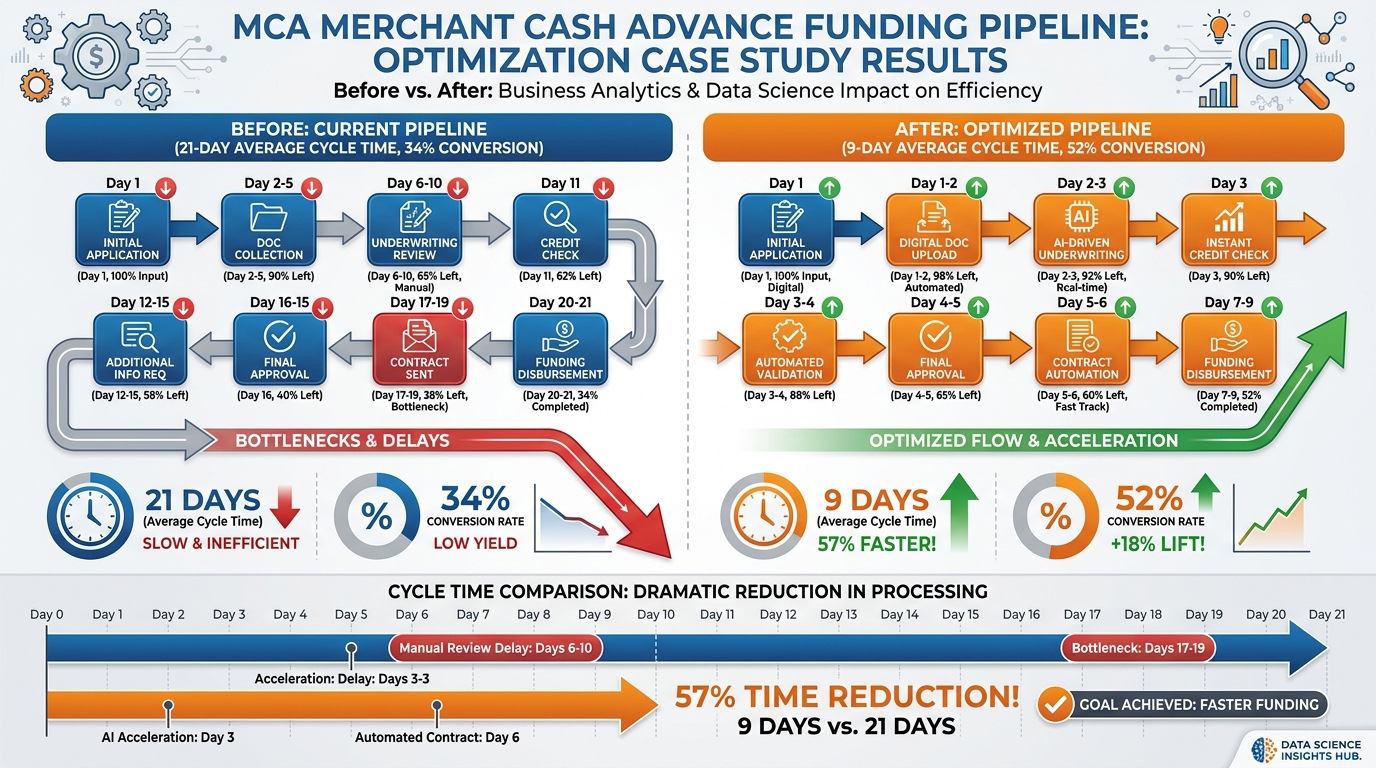
Figure 10:Figure 3.8: The MCA pipeline transformation. A single structural change — moving from fragmented tracking to a unified eight-stage pipeline — cut cycle time by 57% and increased conversion rate by 18 percentage points.
When they implemented a structured eight-stage pipeline in VibeReach, the stages were designed to match the actual MCA funding workflow:
| Stage | Definition | Target Days in Stage |
|---|---|---|
| Application Received | Merchant has submitted initial application | 0–1 |
| Documents Requested | Bank statements, tax returns requested | 1–2 |
| Documents Received | All required documents in system | 2–3 |
| Underwriting | File under internal review | 3–5 |
| Approved | Offer generated and ready for delivery | 5–6 |
| Offer Presented | Merchant reviewing the funding offer | 6–7 |
| Contract Signed | Merchant executed agreement | 7–8 |
| Funded | Capital disbursed to merchant | 8–9 |
Three structural changes made the difference:
First, they created stage time-limit rules. Any deal sitting in “Documents Requested” for more than 48 hours triggered an automatic SMS to the merchant reminding them to submit. Any deal in “Underwriting” for more than 72 hours generated a task for the branch manager to review. The automation enforced velocity.
Second, they created deal-value visibility. Previously, loan officers had no idea what their total open pipeline was worth. When the pipeline board showed 90,000 funding deal got more attention than a $5,000 deal — which was not always the case when everything lived in spreadsheets.
Third, they ran a daily 10-minute pipeline stand-up. Every morning, the branch manager opened the board, scanned for bottlenecks — stages with too many cards piling up — and made real-time decisions about resource allocation.
The results after 90 days:
Average cycle time: 21 days → 9 days (57% reduction)
Conversion rate: 34% → 52% (18-point increase)
Monthly funded volume: 1.9M (73% increase)
Loan officer capacity: Each officer could manage 40% more active files
None of these improvements came from underwriting. They came from visibility. The pipeline board did not change what the business did. It changed what the business could see — and seeing clearly is the prerequisite for acting decisively.
103.10 Lab 3: Design a Three-Pipeline Structure for Your Own Business
A pipeline without stages is just a list of names. A pipeline with the right stages is a decision-support system — it tells you at a glance where every deal stands, what action is needed, and which opportunities are stalling. In this lab, you build three distinct pipelines for your business: a Sales pipeline (converting leads to closed clients), an Onboarding pipeline (delivering your service), and a Renewal pipeline (protecting long-term revenue). Together, they give you complete revenue visibility from first contact through retention.
10.1Step 1: Plan Your Pipelines on Paper (Before You Build)
Before touching the platform, spend 10 minutes on the worksheet:
Sales Pipeline: List the stages a new lead moves through from first contact to closed/won. Common stages: New Lead → Contacted → Qualified → Proposal Sent → Negotiation → Closed Won / Closed Lost
Onboarding Pipeline: List the steps after someone becomes a client. Common stages: Contract Signed → Kickoff Scheduled → Setup In Progress → Delivered → Review Requested → Complete
Renewal Pipeline: List the stages for renewing or retaining existing clients. Common stages: Active Client → Renewal Due (60 days) → Renewal Sent → Renewal Accepted → Churned
Identify for each stage: what action moves a contact from this stage to the next one?
10.2Step 2: Create Your Sales Pipeline
In the left sidebar, click Opportunities (or CRM → Opportunities, depending on your GHL version).
Click + Add Pipeline or the Pipelines tab → + New Pipeline.
Pipeline Name:
[Your Business Name] — SalesClick Create Pipeline.
You’ll know you did this right when: A new pipeline appears in the Pipelines list and you are taken to the stage configuration view.
10.3Step 3: Add Stages to Your Sales Pipeline
You are now in the pipeline stage builder. Add each stage you identified in Step 1:
Click + Add Stage.
Enter the stage name → click Save.
Repeat for each stage.
For the standard sales pipeline:
New LeadContactedQualifiedProposal SentNegotiationClosed Won(mark this as a Won stage in the dropdown)Closed Lost(mark this as a Lost stage in the dropdown)
For each stage, set the Win Probability % — this feeds your pipeline revenue forecast. Example: New Lead = 5%, Qualified = 30%, Proposal Sent = 60%, Negotiation = 80%.
Click Save Pipeline.
You’ll know you did this right when: The pipeline shows all your stages in the correct order, and Closed Won / Closed Lost are marked with the appropriate outcome type.
10.4Step 4: Create Your Onboarding Pipeline
Click + New Pipeline (or return to the Pipelines list → + Add Pipeline).
Pipeline Name:
[Your Business Name] — OnboardingAdd your onboarding stages:
Contract SignedKickoff ScheduledSetup In ProgressDelivered / LiveReview RequestedComplete
Click Save Pipeline.
You’ll know you did this right when: A second pipeline appears in your Pipelines list with its own set of stages. It is completely separate from the Sales pipeline.
10.5Step 5: Create Your Renewal Pipeline
+ New Pipeline → Pipeline Name:
[Your Business Name] — RenewalsAdd stages:
Active ClientRenewal Due — 60 DaysRenewal SentRenewal Accepted(mark as Won)Churned(mark as Lost)
Save Pipeline.
You’ll know you did this right when: A third pipeline exists in your list. All three pipelines (Sales, Onboarding, Renewals) are visible and distinct.
10.6Step 6: Create Your First Opportunity
Now populate your Sales pipeline with a real (or practice) deal:
Click into your Sales pipeline → click + Add Opportunity (or + New Opportunity).
Configure:
Opportunity Name:
[Contact Name] — [Service](e.g., “Rivera Roofing — Marketing Retainer”)Contact: Search for and select a contact from your imported Lab 1 contacts
Pipeline: Sales pipeline
Stage:
New LeadValue: Enter the estimated deal value in dollars
Assigned To: Yourself
Click Save.
You’ll know you did this right when: The opportunity appears in the Kanban board view under the “New Lead” column with the contact name, value, and your name as assigned.
10.7Step 7: Practice Moving Opportunities and Run the Morning Ritual
Click the opportunity card you just created → drag it to the Contacted stage.
Add a note: “Initial call completed — prospect is interested in retainer.”
Create a task: “Send proposal by [date]” with a due date.
Click Save.
The Morning Stand-Up Ritual: Every business day, open your Opportunities board and scan for:
Anything in “New Lead” for more than 24 hours with no activity
Anything in “Proposal Sent” for more than 7 days with no movement
Anything in “Negotiation” with a close date in the past
These three checks — 2 minutes total — are how you prevent deals from dying quietly in a stage with no follow-up.
You’ll know you did this right when: The opportunity has a note, a task, and shows the updated stage. The Kanban board shows at least one card in a stage beyond “New Lead.”
Troubleshooting Common Issues
“+ New Pipeline” button is not visible: Check that you are in the Opportunities section of the left sidebar (not Contacts or Conversations). Some GHL accounts organize this under CRM → Pipelines. If you’re using the mobile app, switch to desktop browser for pipeline configuration.
Stages are saving but showing in the wrong order: GHL allows you to drag and reorder stages in the pipeline builder. After adding all stages, drag them into the correct sequence before saving. If order is wrong after save, click the edit (pencil) icon next to the pipeline and drag to reorder.
Win probability percentages aren’t appearing: Win probability is set per stage in the stage configuration. Click the stage name to expand its settings and look for “Win Probability” or “Stage Probability.” This field may be labeled differently depending on your GHL version.
An opportunity isn’t showing the pipeline value in reports: The opportunity must have a numeric Value entered. Opportunities with a $0 value or no value entered are excluded from pipeline revenue calculations. Edit the opportunity and enter the estimated deal value.
The pipeline shows in “List View” but I want the Kanban board: In the Opportunities view, look for a View toggle (usually top-right) with icons for List, Kanban, and sometimes Calendar. Click the Kanban icon (grid of squares) to switch to the board view where deals appear as draggable cards.
113.11 Chapter Takeaways & Reflection Questions
11.1Key Takeaways
The pipeline is a cognitive tool, not just a software feature. The column-based Kanban format reduces cognitive load, enables pattern recognition, and makes decision-making faster and more accurate. This is human-computer interaction by design.
Contacts and opportunities are different things. A contact is a person. An opportunity is a potential transaction with a value, stage, and probability. Conflating them creates forecasting chaos. Separating them creates clarity.
Stage names are behavioral prompts. Action-oriented, past-tense stage names (“Proposal Sent”) create momentum. Vague state-based names (“In Progress”) create stagnation. Name your stages as completed events, not ongoing conditions.
Multiple pipelines serve multiple business motions. A Sales Pipeline closes deals. An Onboarding Pipeline delivers promises. A Renewal Pipeline protects revenue. A mature business runs all three.
Weighted pipeline forecasting is the only responsible way to project revenue. Multiplying deal value by win probability produces a reliable forecast. Raw pipeline totals produce fantasy.
The morning stand-up ritual transforms a reactive day into a proactive one. Fifteen minutes on the pipeline board every morning — filtering, prioritizing, and assigning specific actions — is worth more than three hours of reactive email management.
Pipeline hygiene is non-negotiable. The 30-day rule — every deal moves forward or gets marked Lost within 30 days of inactivity — keeps your pipeline trustworthy and your forecast reliable.
11.2Reflection Questions
Think about the last three deals your business pursued. Could you define a specific event that marked entry into each stage, and a specific event that would have triggered the move to the next stage? What does this exercise reveal about how clearly your sales process is currently defined?
What is your current method for forecasting revenue — and how does it account for the probability that early-stage deals do not always close? How would a weighted pipeline forecast change the decisions you make about hiring, spending, or marketing investment?
Consider the distinction between a Sales Pipeline and an Onboarding Pipeline. In your current business, what happens to a client the moment they sign a contract? Is that handoff tracked, measured, and managed — or does it rely on individual heroics and institutional memory?
The MCA case study showed that the bottleneck was visibility, not process. Think about a bottleneck in your own business. Is it a process problem or a visibility problem? How would you distinguish between the two?
12Discussion
Discussion Prompt:
The Kanban principle — visualizing work as cards moving through columns — has been applied successfully in manufacturing, software development, and now sales. But some argue that sales is fundamentally different from manufacturing: a prospect is not a physical widget, and relationships do not move on predictable timelines. Others argue that the discipline of a structured pipeline is precisely what unpredictable sales processes need most.
Where do you stand? In your view, does the Kanban model fit the reality of human sales relationships — or does it oversimplify the complexity of how people actually decide to buy? Draw on your own sales experience, the research presented in this chapter, and at least one credible external source to support your position.
Discussion Guidelines: Write a substantive response of at least 200 words addressing the prompt above. Include at least one scholarly or credible citation (journal article, textbook, or authoritative industry report) to support your argument. Then respond to at least TWO peers with substantive feedback — go beyond “I agree” and explain why their perspective adds to or challenges your thinking.
13Exercises
---

## Glossary

:::{glossary}
Aging deal
  An opportunity that has not had any logged activity (call, email, note, stage change) within a defined time window, typically 7 or more days. Aging deals are a key indicator of pipeline health deterioration.

Board view
  The Kanban-style column layout of a CRM pipeline, where opportunity cards are displayed in vertical columns representing stages. Contrasted with list view, which displays opportunities in a sortable table.

Churn
  The loss of an existing customer, typically measured as a rate (e.g., 5% monthly churn). A Renewal Pipeline is specifically designed to reduce churn by proactively managing the renewal conversation.

Closed Lost
  The terminal stage designation for an opportunity that did not result in a sale. Marking a deal Closed Lost with a loss reason is a data-collection practice, not a judgment of the salesperson.

Closed Won
  The terminal stage designation for an opportunity that converted to a sale. In VibeReach, Closed Won can trigger automated onboarding workflows and new opportunity creation in the Onboarding Pipeline.

CRM (Customer Relationship Management)
  A platform that centralizes contact data, opportunity tracking, communication history, and workflow automation for a business's customer relationships.

Deal aging heatmap
  A visual representation that maps opportunity cards against time-since-last-activity, using color coding (green/yellow/orange/red) to identify deals at different levels of staleness risk.

Deal value
  The estimated revenue associated with a specific opportunity if it closes successfully. Used in pipeline forecasting and prioritization.

Forecasting
  The process of projecting future revenue based on current pipeline data. The most reliable forecasting method multiplies deal value by win probability for each open opportunity and sums the results.

Kanban
  A visual workflow management system originating from Toyota's manufacturing process (1948), in which work items are represented as cards moving through columns that represent stages of completion.

Loss reason
  A categorical label applied to a Closed Lost opportunity that identifies why the deal did not close (e.g., Non-Responsive, Went with Competitor, Budget Eliminated). Loss reason data informs product, marketing, and sales coaching decisions.

Onboarding Pipeline
  A CRM pipeline designed to track and manage the client experience from contract signing through successful delivery of initial service. Starts where the Sales Pipeline ends.

Opportunity
  A specific potential transaction in a CRM system, associated with a contact, assigned to a pipeline stage, and carrying a deal value and close date. An opportunity is distinct from a contact.

Pipeline
  A structured sequence of stages in a CRM system that models a specific customer journey or business motion. A business typically operates multiple parallel pipelines (Sales, Onboarding, Renewal).

Pipeline hygiene
  The ongoing discipline of keeping pipeline data current, accurate, and actionable — including regular review of aging deals, consistent stage-movement documentation, and timely marking of Lost opportunities.

Renewal Pipeline
  A CRM pipeline designed to manage the customer retention conversation, typically beginning 60–90 days before a contract or subscription expires.

Stage
  A named position within a pipeline representing a specific, verifiable milestone in the deal's progress. Best defined by completed past-tense actions rather than ongoing states.

Weighted pipeline
  A forecast methodology in which each opportunity's deal value is multiplied by the win probability of its current stage, and the results are summed to produce a probability-adjusted revenue projection.

Win probability
  The estimated likelihood (as a percentage) that an opportunity will close successfully, typically assigned at the stage level and calibrated over time using historical close rate data.
:::

---

## 🎯 Your Turn: Apply It to Your Business

A pipeline that lives in someone's head is not a pipeline. It's anxiety with ambition. Today you move your sales process from mental real estate into VibeReach — visible, measurable, and manageable.

**1. Map your actual sales stages before touching GHL.**
On paper, write down every stage a deal goes through in your business from "brand new lead" to "closed." Be specific — not just "New Lead" and "Closed Won," but every meaningful handoff point in between. A dental practice might have: Inquiry → Consultation Booked → Consultation Attended → Treatment Plan Sent → Treatment Plan Accepted → Scheduled → Completed. A consultant might have: Discovery Call → Proposal Sent → Proposal Reviewed → Contract Signed → Onboarded. Write yours out. Count the stages. If you have more than eight, consider whether some should be combined.

**2. Assign win probabilities to each stage.**
Next to each stage you just mapped, write the percentage of deals that historically make it from that stage to "Closed Won." If you don't have clean data yet, estimate based on experience. New Lead = 15%. Proposal Sent = 40%. Contract Signed = 90%. These numbers become your weighted pipeline forecast. In GHL → **Opportunities → Pipelines**, you'll configure these probabilities at the stage level.

**3. Build your pipeline in GHL right now.**
Log into your GHL account. Go to **Opportunities → Pipelines → + Add Pipeline**. Name it after your primary offer or service line. Add the stages you mapped in Step 1. Set win probabilities. Save. Then create three test opportunities — one in the early stage, one mid-funnel, one late-stage — with real deal values from your business. Look at the board. That's your business as a visual system. Does it feel accurate?

**4. Identify your top five "stale" deals.**
Every business has deals that are stuck — sitting in the same stage for weeks with no movement. In GHL → **Opportunities**, filter by pipeline stage and sort by "Last Stage Change" ascending. Find the five oldest. For each one: Is it still a real opportunity? If yes, what's the one action that would move it forward today? Create a task for each one. If no, close it out as "Lost" with a reason noted. A clean pipeline is more accurate than a full one.

**5. Set up stage-based automation for your most important handoff.**
Identify the one pipeline stage transition where deals most often stall because of a human delay — usually "Proposal Sent" waiting for a follow-up. In GHL → **Automation → Workflows**, build a simple workflow: Trigger = Opportunity Stage Changed to [that stage]. Action = Create Task for the assigned rep: "Follow up on proposal within 24 hours." Save and publish. You just eliminated the most common pipeline bottleneck in most service businesses.

:::{admonition} 🏋️ Stretch Challenge
:class: tip
Calculate your true pipeline velocity: average deal value × win rate ÷ average sales cycle length (in days). If your average deal is $3,000, your overall close rate is 25%, and your average cycle is 30 days, your pipeline velocity is $25/day. Now look at your current pipeline total. Divide by your velocity to estimate how many days until that revenue closes. Compare that number to your actual revenue targets. Is the pipeline big enough? This exercise often reveals that the issue isn't close rate — it's lead volume. Knowing that changes where you invest next.
:::